Whatever your digital marketing goals, visuals can help.
Rank high in search… get shared on social… grow your email list… get your emails opened… keep your visitors’ attention… win links from other websites… get views on your videos… get registrants for your events… turn visitors into leads.
Without good use of marketing visuals, these things are possible, but not as likely.
Images and videos, charts and diagrams, faces and thumbnails. They can drive all of these marketing outcomes. And the results are 100% measurable. We’ll start with a video summary and then move into a detailed guide for using visuals in marketing.
If you map them to the funnel stages, the tactics and their outcomes look like this:
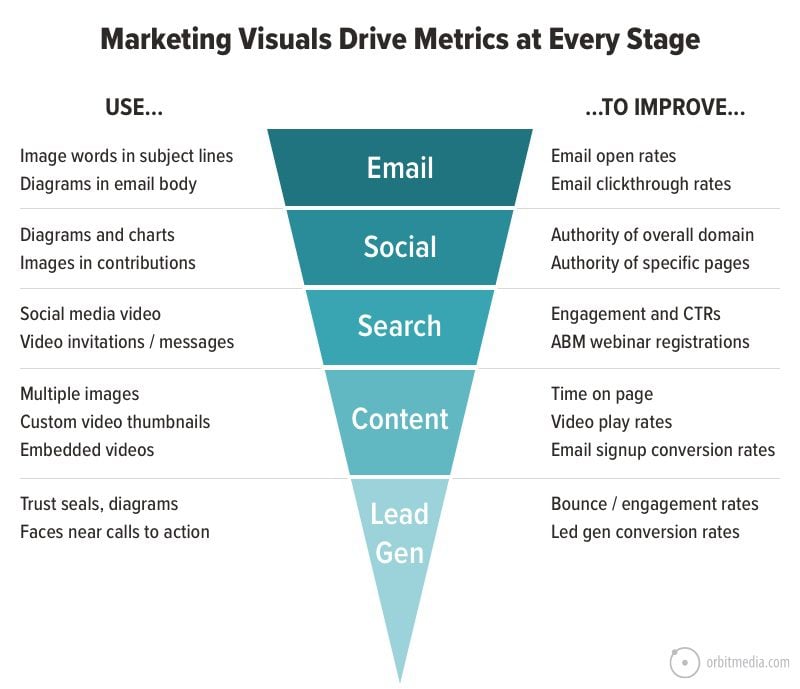
Let’s take a closer look at each specific type of visual marketing and the ways in which they support metrics.
How visuals drive email marketing
We’ll start with a channel that is thought of as just text, but images actually have a huge impact: email marketing. The classic metrics are open rates and clickthrough rates. Visuals can improve both.
1. Open rates: Subject line words
The subject line has one job: to win the recipient’s click.
It has two ways of doing that job: by indicating the content is valuable and/or indicating that it’s easy to consume. In other words, when they see your message in their inbox, they’re doing a quick cost/benefit calculation and your subject line needs to show a low cost and a high benefit.
Numbers in subject lines make the cost feel low when they indicate it’s a list post. “Oh, this email has 12 ways to improve open rates? Maybe I’ll open it and scan through the list.”
Image words in subject lines work the same way. “Oh, this email has a diagram that shows how to improve open rates? Maybe I’ll open it and take a quick look.”
We often send emails with image words in subject lines. Here are some examples with the image words.
- Pictures of the desks: 26 top marketers take us inside
- This flowchart shows the entire content creation process
- How much do marketers make? 5 charts that show salary trends
- 55 marketing diagrams: Swipe files of visuals you can use in your content
- 7 charts that show how to make better marketing decisions
- The 3 types of search Intent in one big diagram
These are generally the emails with the highest open (and clickthrough) rates. Here is the data:
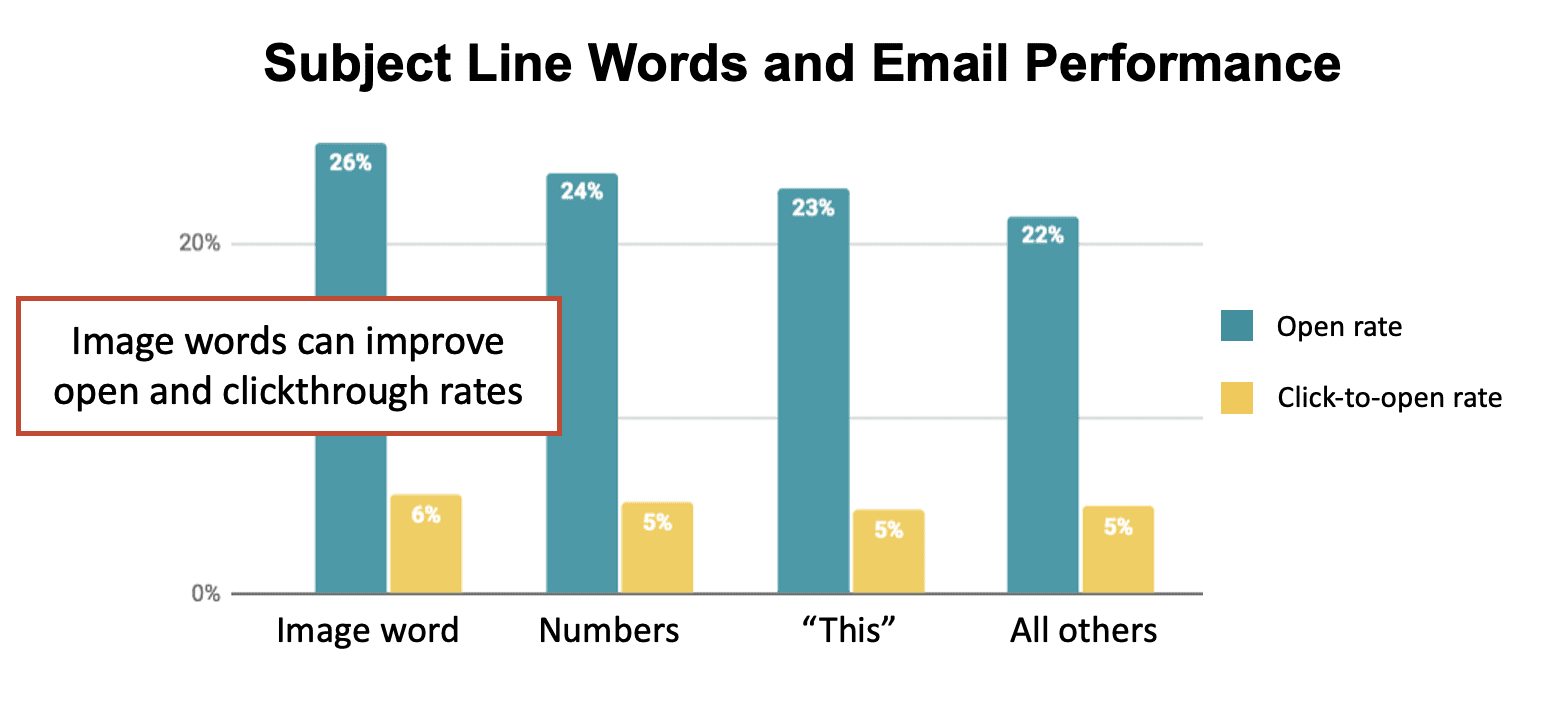
Note: this is a small dataset and some subject lines fit into more than one category. Test this one for yourself. If you learn something, please let us know!
2. Clickthrough rates: HTML email images
The open rate is only the first step. You haven’t won a visitor until they click on a link or button.
Some emails are text. They’re good because they’re fast, direct and look like a regular message. Other emails are HTML. They’re good because they are visual. There is no conclusive research on which is better. It will depend on your audience and your topic.
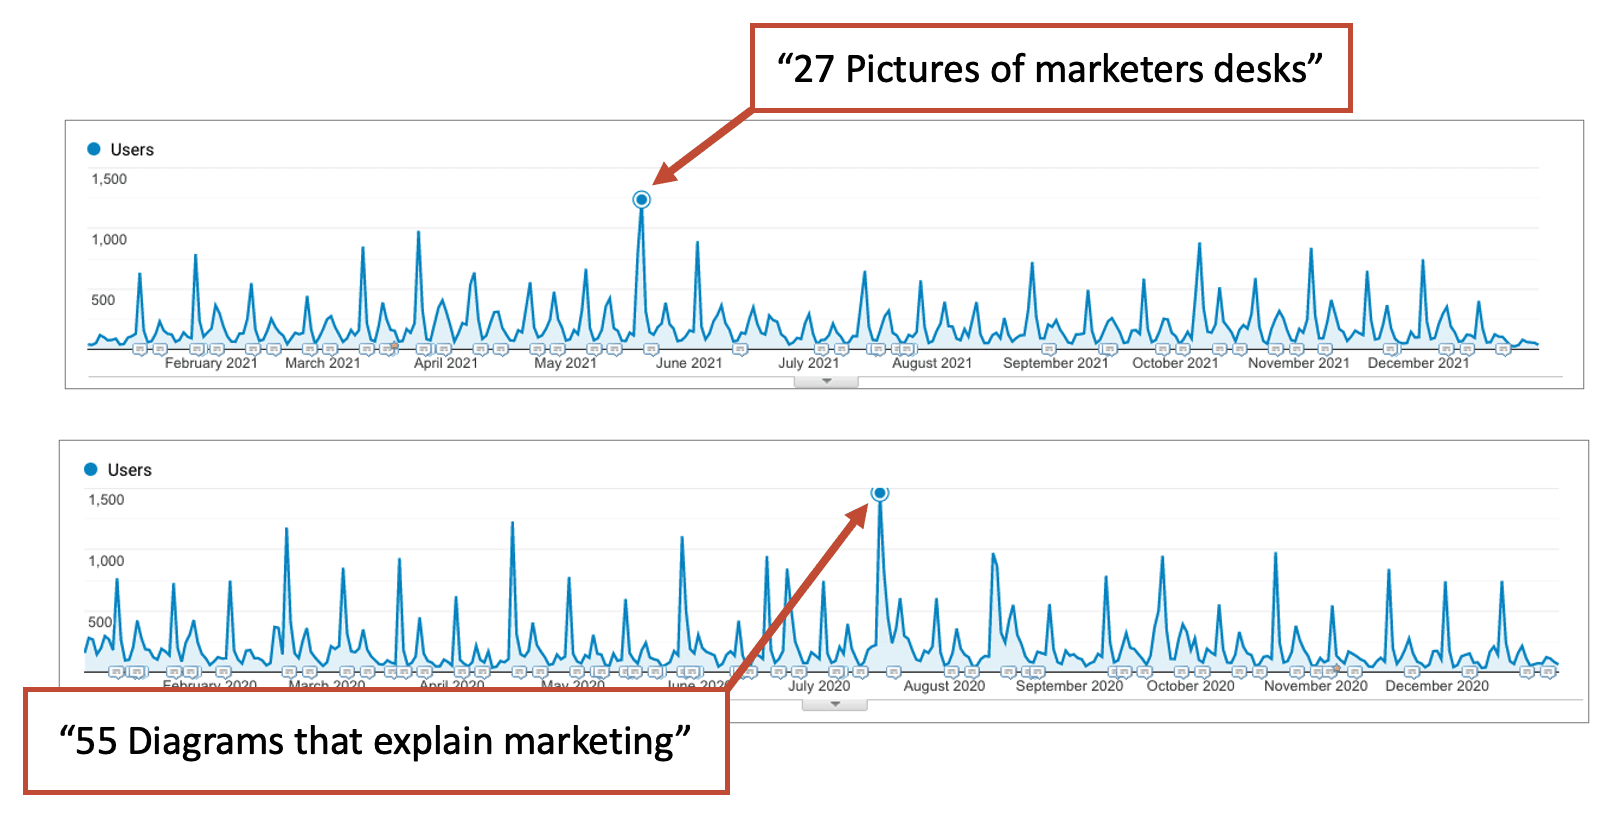
In our experience, adding a visual (usually a chart or diagram) to the HTML helps win the click. Not only do they preview the content; they’re a giant tap target. Every year, our top-performing email campaigns are emails with image word subject lines and diagrams within the email body.
Here’s our email campaign data from each of the last two years with the top performer called out.
How visuals drive social media marketing
This one is more obvious. Social media is clearly a very visual channel. After all, Facebook starts with the word “face” and the Instagram logo is a camera.
But which specific marketing visuals drive which marketing metrics?
3. Clickthrough rates: Social media videos
The user is flowing through a stream of posts. You need to make yours a “thumb stopper” and get them to slow down and look more closely. Videos can do the trick.
Making a typical social post takes 2-3 minutes. Making a one-minute video with captions may take 20-30 minutes. So it’s definitely a 10x effort.
But these are exactly the types of posts that drive 100x results. If you add campaign tracking code to the link, you can see the actual traffic from the post in Google Analytics. Don’t be surprised if you see dozens or even hundreds of clicks from a single post.
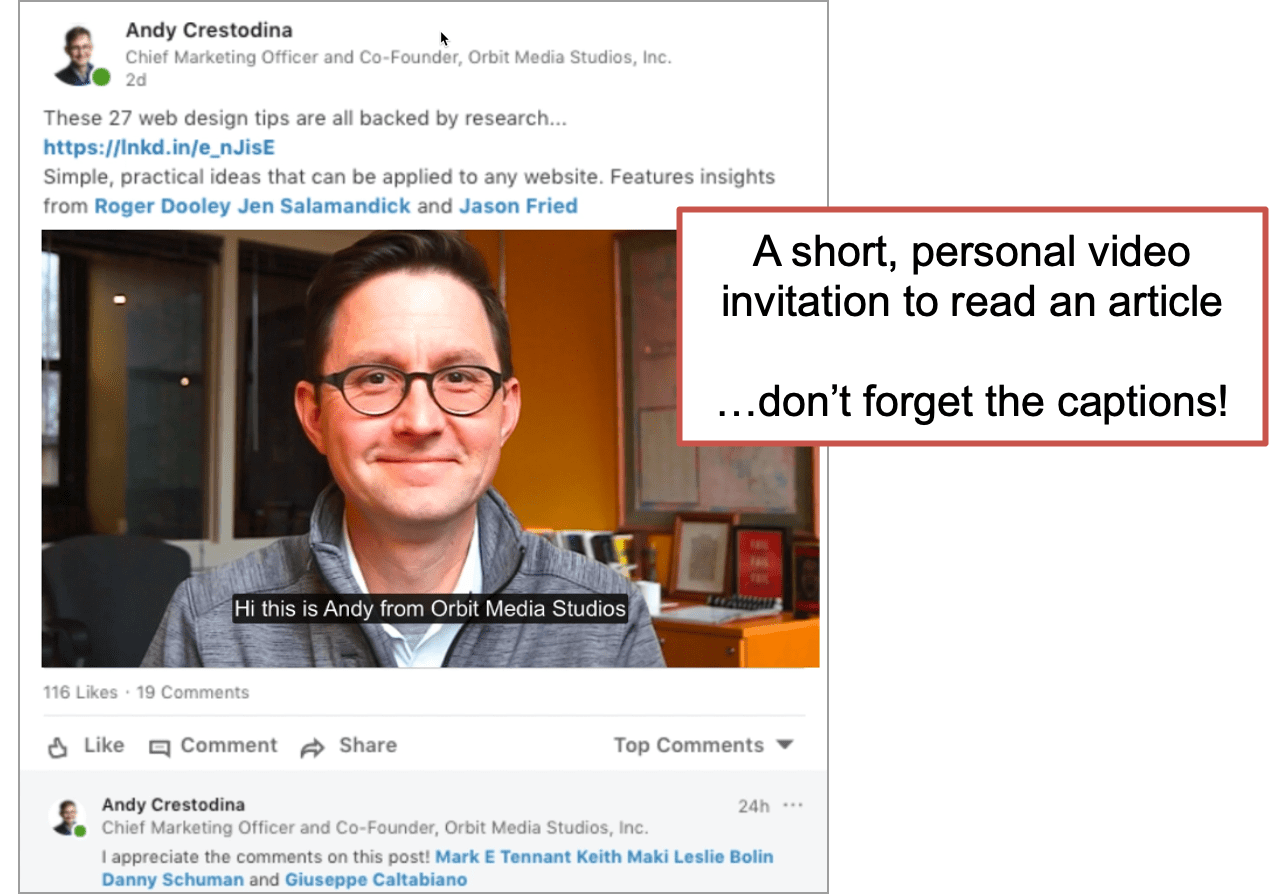
We recommend making these videos brief, personal and direct. Here are the tools to make and track social media videos.
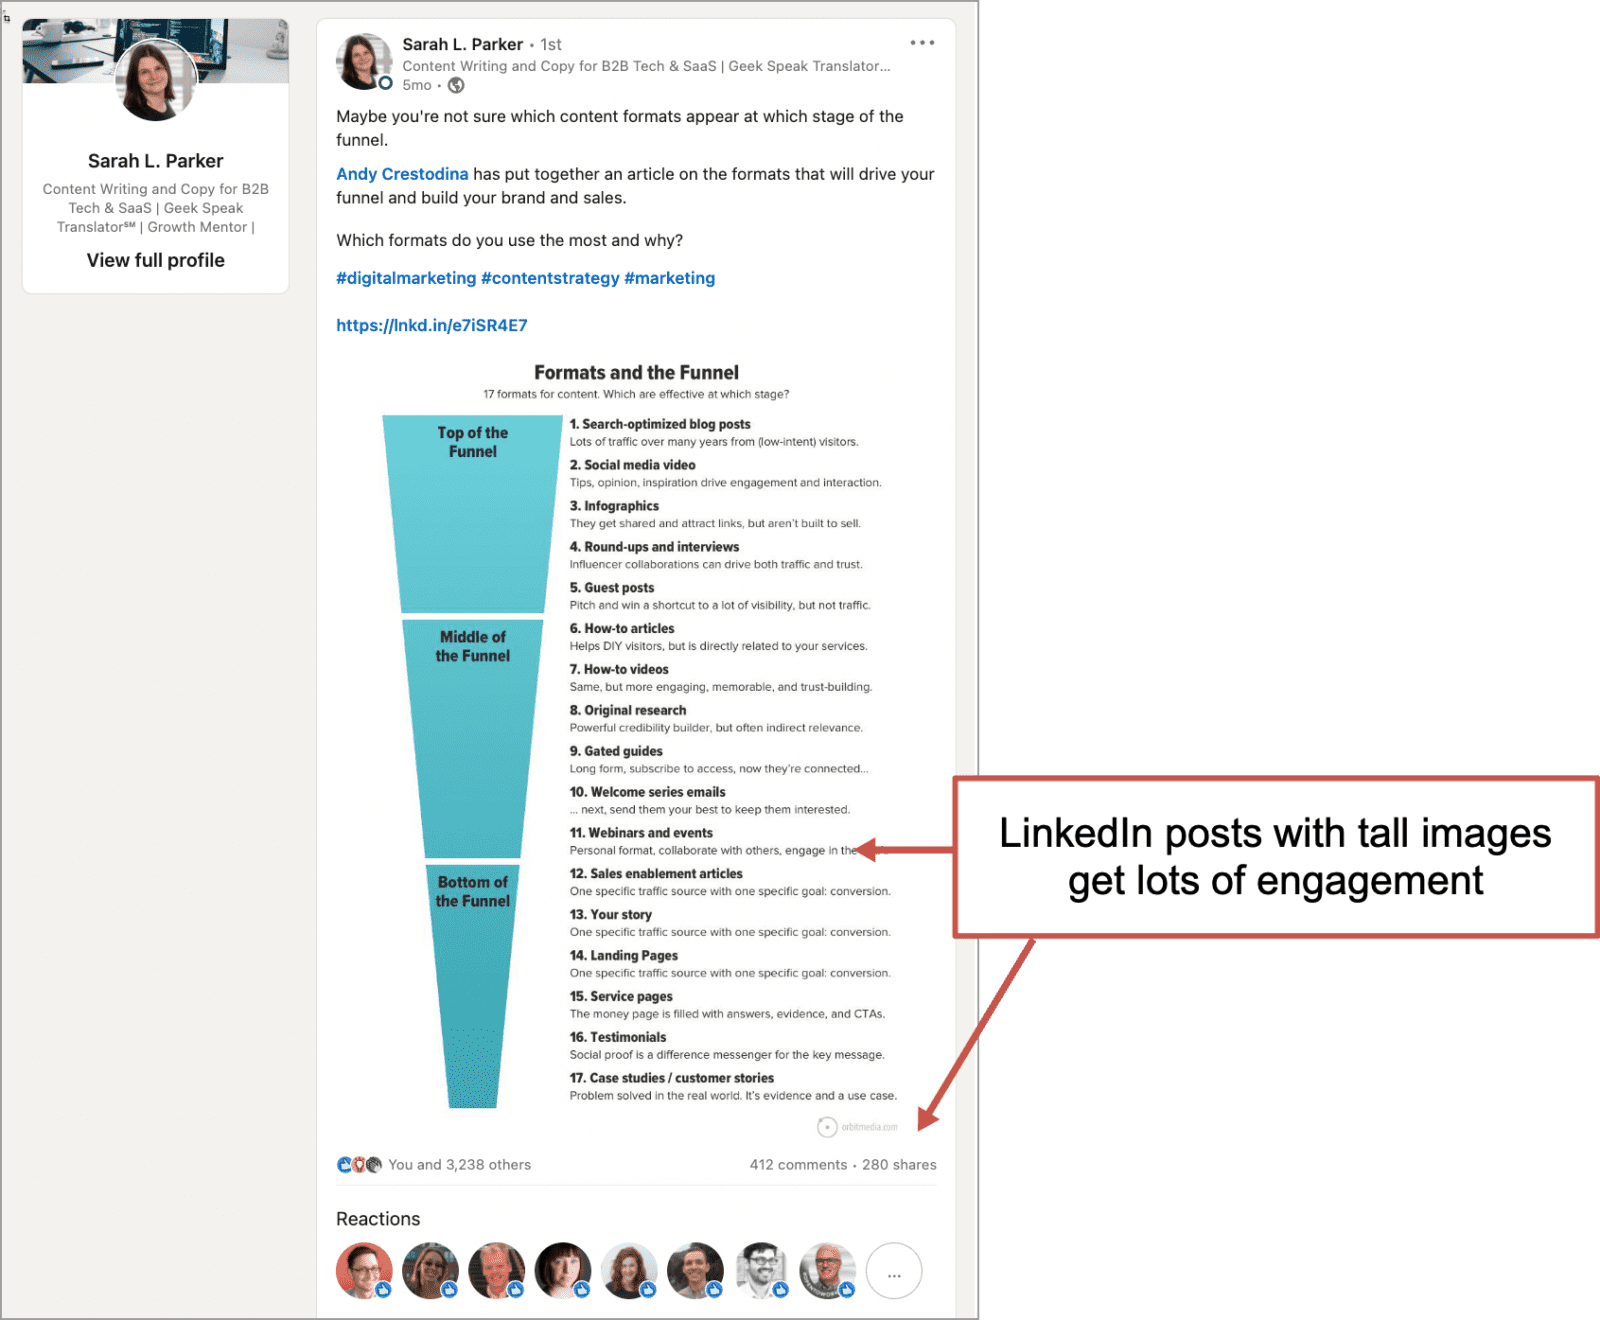
4. Engagement: Tall images
We don’t have research data on this, but we have enough examples to recommend the approach: use tall images in LinkedIn. These social media posts often get huge engagement. Amanda swears by them.
It makes sense. The pixel height of the image dominates the user’s viewport, both on mobile and desktop. Almost like blockbuster style graffiti, it’s sure to catch attention.
If the visual is meaningful (research data, a diagram or a simple infographic) it will hold their attention. That’s how you trigger the algorithm to show it to an exponentially larger audience.
This post by content pro Sarah Parker is a good example. It got 3000+ reactions, 400+ comments and hundreds of shares. It’s a mini-case study in video content and social engagement.
 |
Brooke Sellas B Squared Media“We noticed on LinkedIn that pithy, text-only quotes were gaining a lot of traction for engagement and conversation. To take it further, we used Canva to create these quotes with an image behind them (meme) and a small amount of motion (“video”). We found that both engagement and conversation skyrocketed even further — and these take about 5 minutes to create!” |
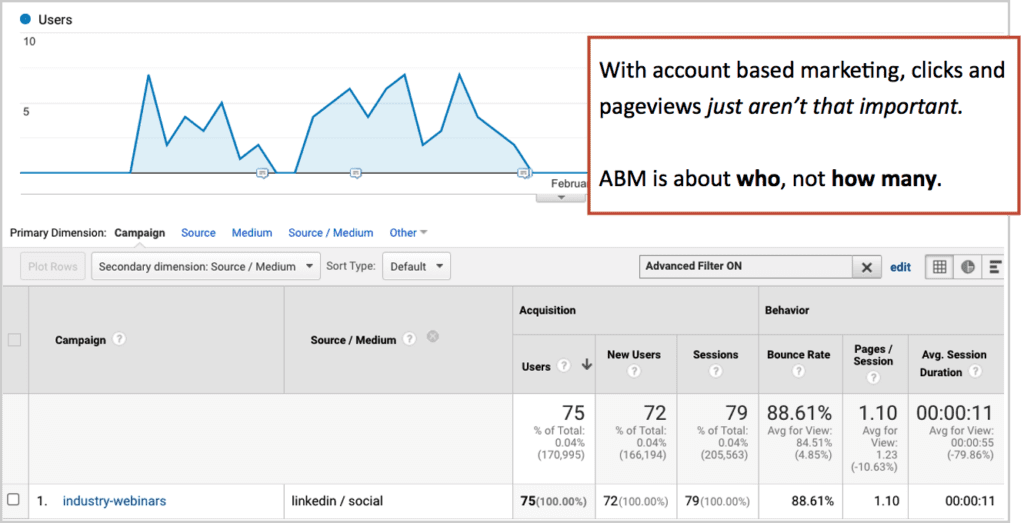
5. Webinar registrations: Video invites for ABM program
When you pick your future prospects first, create content specifically for them, then reach out to them directly, it’s called “Account Based Content Marketing.” It’s far more efficient to fish with a spear than a net. No bycatch.
We do original research around an industry, put together a presentation, and invite our LinkedIn connections to join us for a webinar. These are quick, personal video invitations, used in direct messages to existing connections on LinkedIn. The video is also added to the webinar landing page.
You can see an example in our playbook. It’s in step three.
These programs are about quality, not quantity. But we still track clickthrough rates from these invites. 100 messages are sent. 75 of them click. 40 of them register. 20 attend. Five become leads. Two become clients.
How visuals drive search
Search engines are more visual every day. SERPs (that’s “search engine results pages”) are filled with more visual content, thumbnail images and videos, than ever before. In some cases, you’ll see 4x as many images in a search results page today than just five years ago.
So how can a marketer use visuals to drive rankings and visibility?
6. Visibility: SEO with YouTube
Search results pages are filled with videos, more than ever before. Visuals appearing in search results is one of the biggest SEO trends. Just look at these screenshots of Google over the years.
You can look at this trend with one of two mindsets, scarcity or abundance.
- Videos reduce clickthrough rates to websites …so the content marketer is sad.
- Videos are another opportunity to appear in search …so the content marketer is happy.
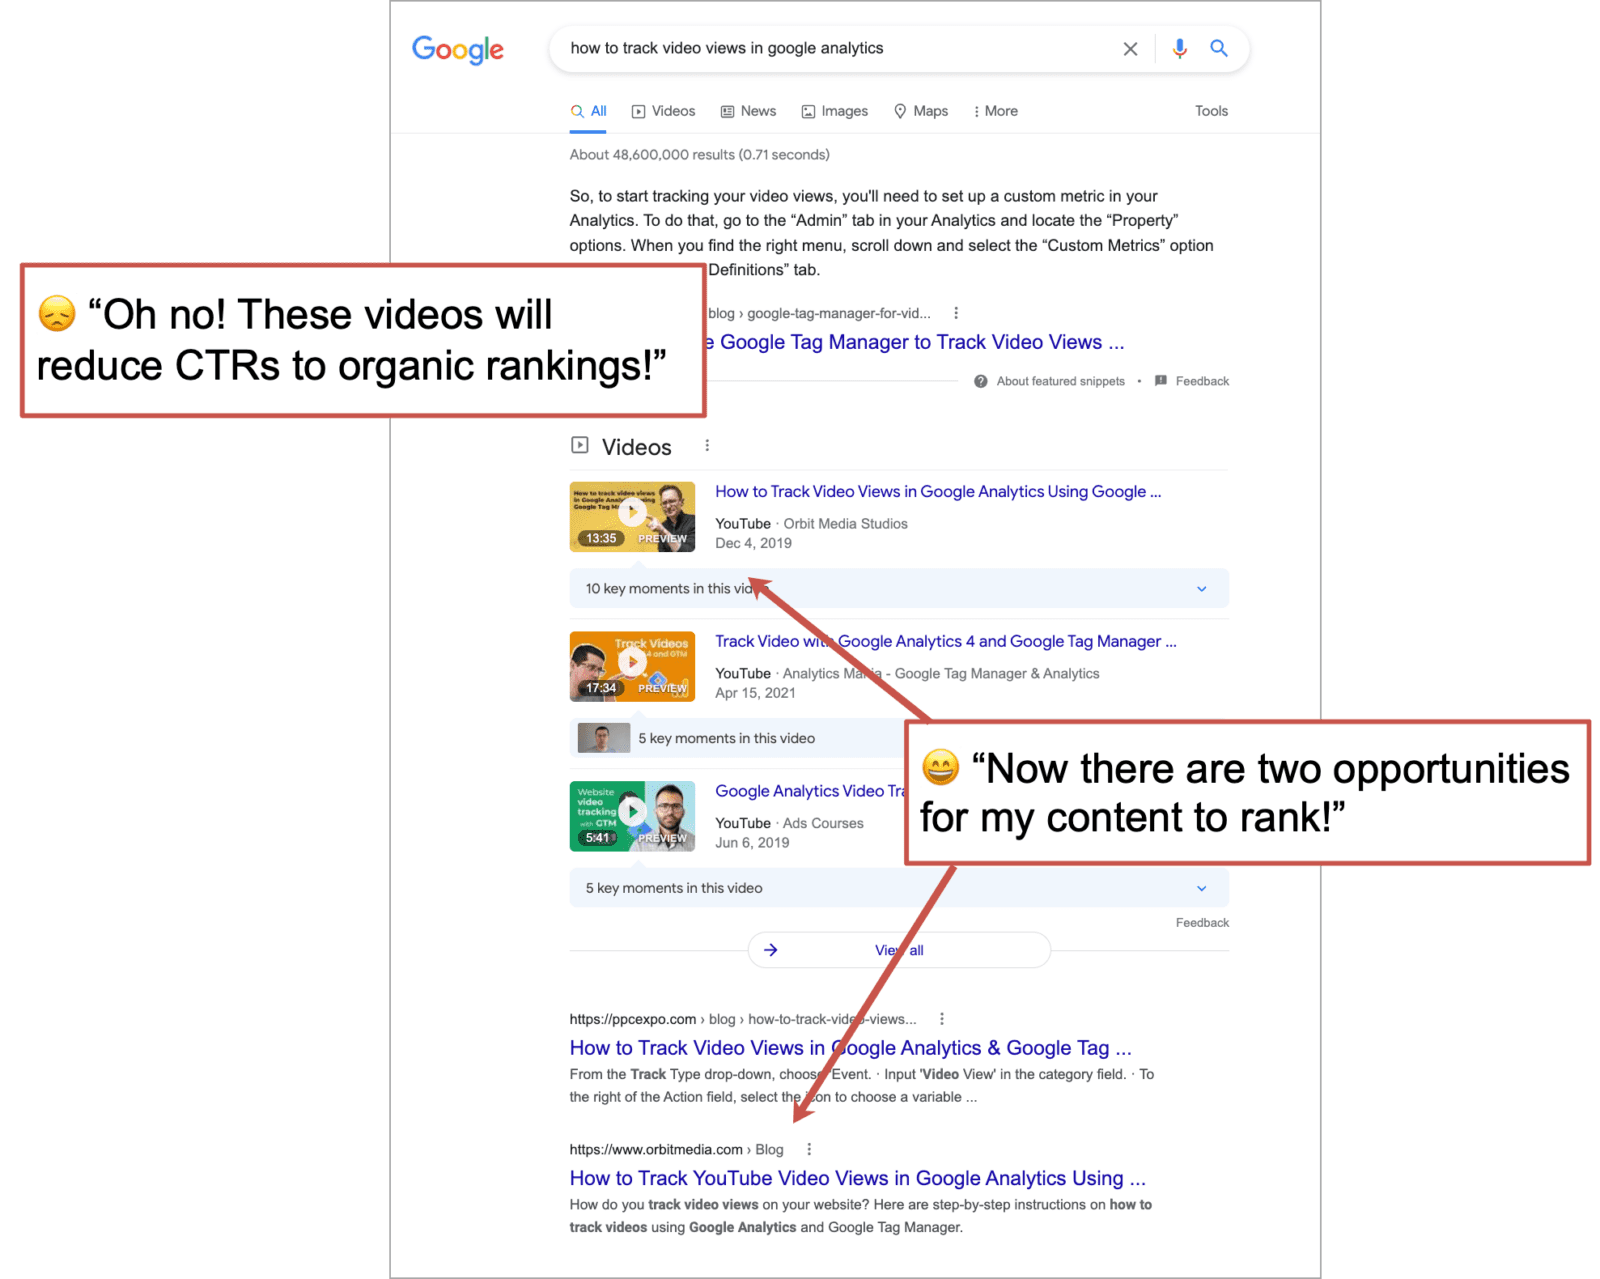
If you create search optimized videos on topics that people search for, you have a new opportunity to be visible in search results. True, this is visibility without traffic (they’re not going to touch your website) but it’s still worth something. It’s still brand awareness.
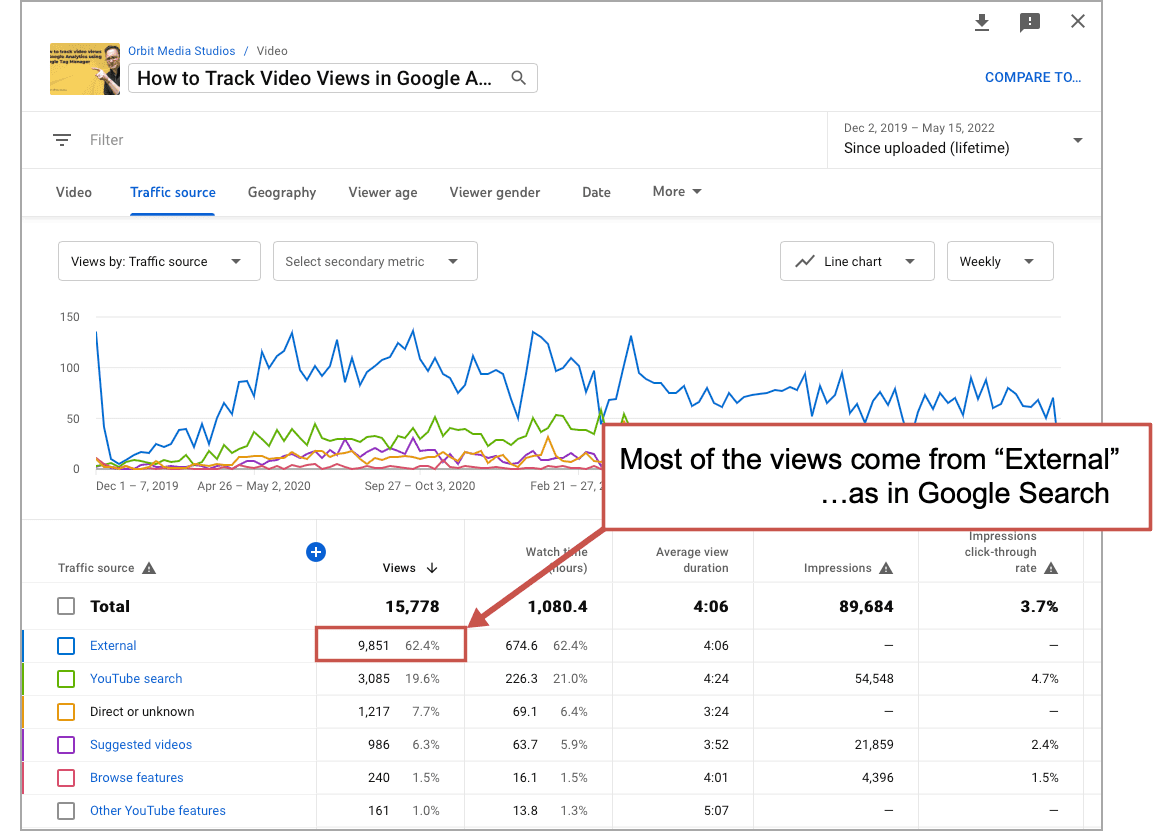
Here is what the analytics in YouTube Studio look like for a video that ranks in Google. In this example, you can see nearly 10,000 views attributable to search. If we hadn’t made the video, someone else would have won those views.
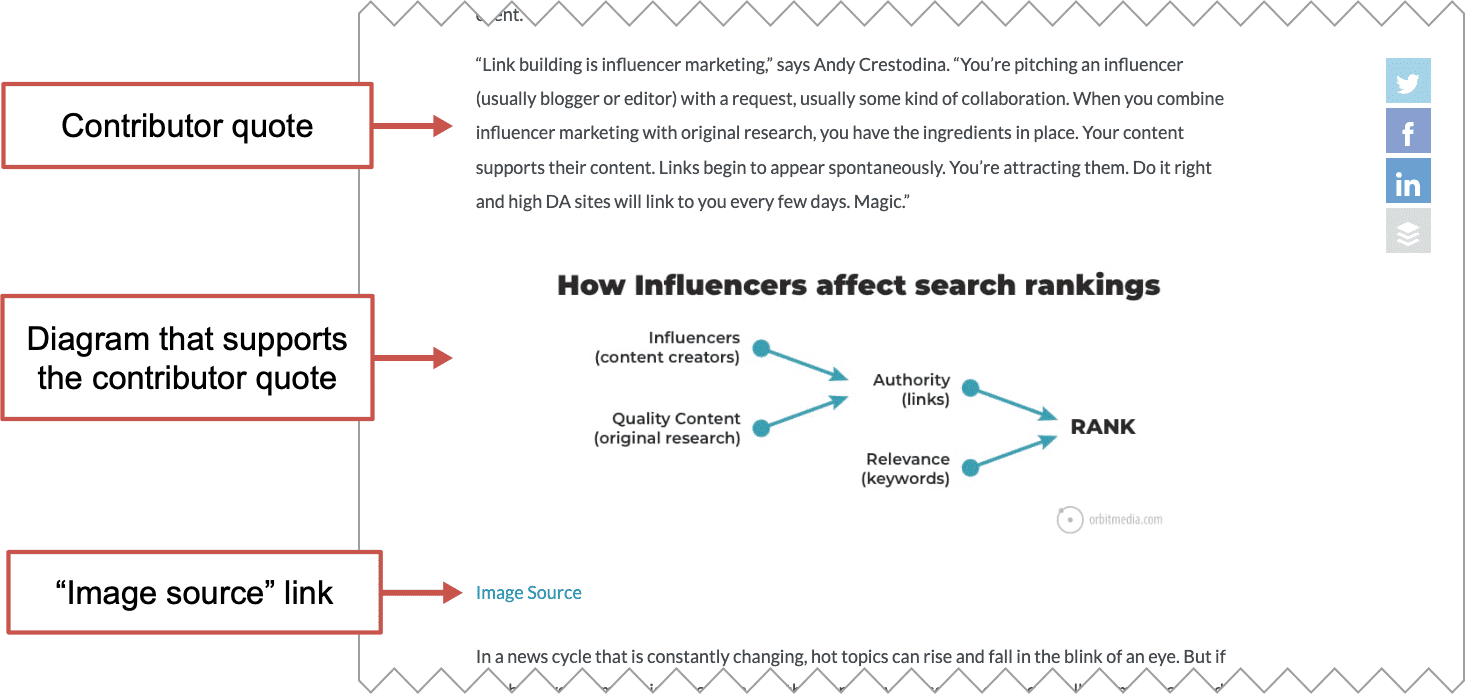
7. Authority: Link attraction
All bloggers know that images make content more engaging. But not all bloggers have time to make images themselves. When you create a visual, you create a chance to get picked up by a blogger. If the visual supports their message, they may add it …and add a link to you, the original source.
Some images attract links more than others. These are the best formats:
- Data visualizations (charts)
- Visual explanations (diagrams)
- Maps
- Infographics
When this works the link points back to a specific article. If that article is search optimized, the link may make the difference in how well it ranks. Visuals are so important for link attraction, that you may eventually conclude that articles without diagrams have a disadvantage in search.
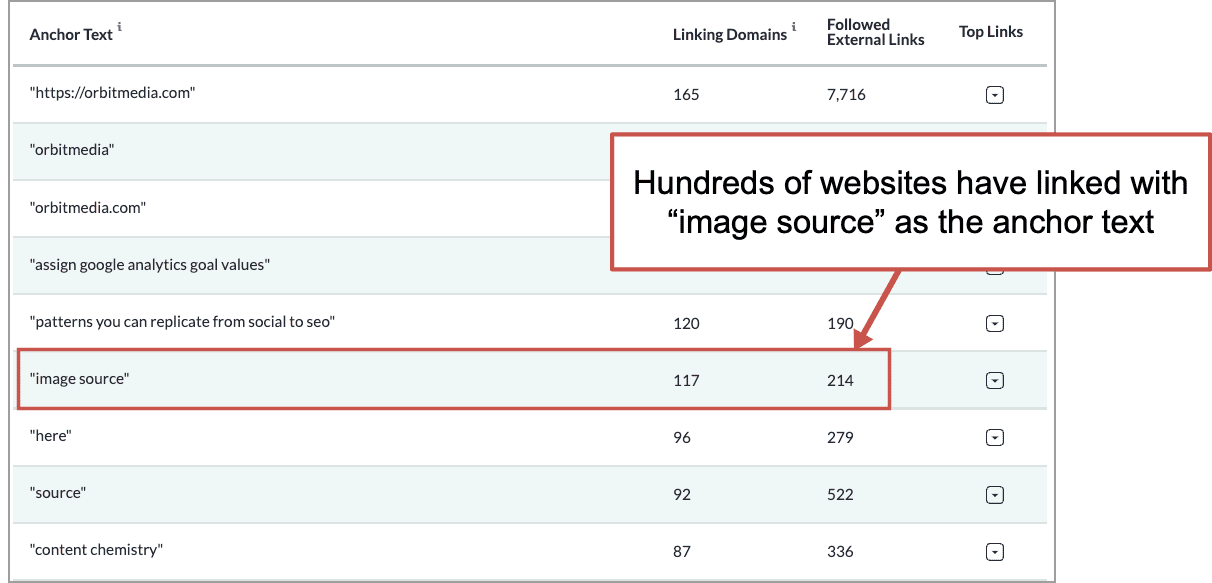
Use an SEO tool (or Google Search Console) you may see dozens or hundreds of backlinks with “image source” in the anchor text. This is evidence that you’re creating useful visuals.
8. Authority: Contributions in digital PR
A lot of link building strategies look something like this: conduct some research, summarize it in an infographic, share it with journalists. This is one type of “digital PR.”
Another approach is more organic. Build relationships with content creators by including contributor quotes in your articles. Once you’ve built up your network, they’ll start asking you to contribute to their articles.
Two things happen when you add images to your contributions. First, the writer is more likely to put your contribution at the top. Second, they’ll definitely link back to the source of the image on your site.
The SEOs who grumble that editors remove their links probably aren’t including images.
How visuals drive engagement on articles
Click! You have a visitor. Your next marketing metrics are about engagement and conversion. The likelihood that they’ll stay on the article and subscribe to your newsletter are both affected by visuals. These are central to a content marketing strategy.
9. Time on page / Engagement time: Multiple images
Think about the traffic source of your visitor: a social stream, an email inbox or a search results page. These are crowded channels filled with lots of interesting, clickable things. Your new visitor knows they have options and the back button is right there.
Engage them fast or lose them forever.
They’re scanning and scrolling, looking for something valuable. Visuals are your best chance to hook them, slow them down, get them to read deeply. And one image isn’t enough to do this job.
We recommend adding visuals throughout the post. Add an image or video at every scroll depth. This is visual content marketing and a blog image best practice. If you can’t find or create a relevant visual, make up for it with scannable formatting. That means subheads, bullets, bolding, internal links and short paragraphs.
 |
Steph Hermanson Atomic Revenue“Individuals process visuals 60,000x faster than text. A block or wall of text is next to impossible for our brains to process so when in doubt – break it up. Use a visual, use a list, write a short sentence and leave it hanging alone in space. This blog itself is a great example of this practice.” |
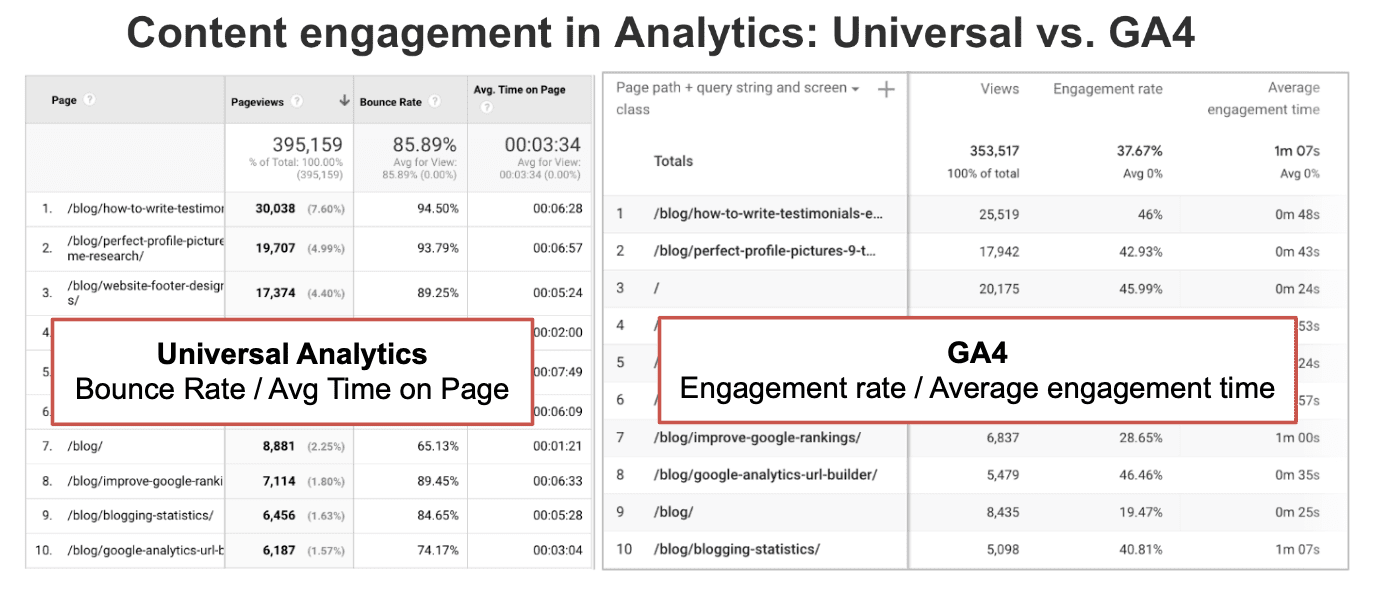
The impact is evident in Google Analytics. In Universal Analytics, check Bounce Rate and Average Time on Page. In GA4, check Engagement Rate and Average engagement time.
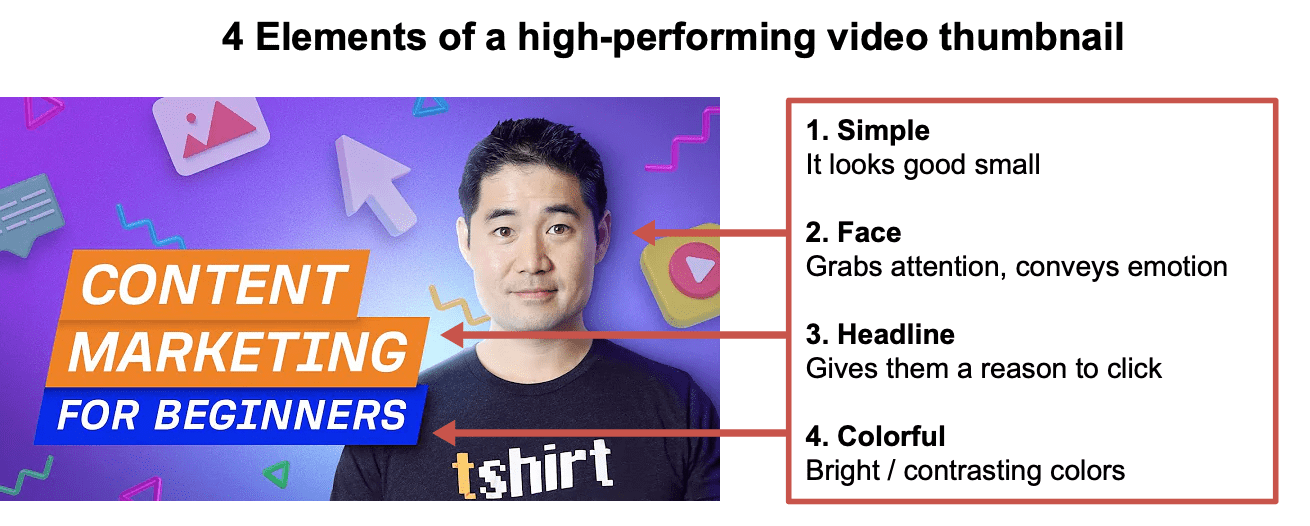
10. Play rates: Video thumbnails
On YouTube, there are only a few ways to increase the likelihood that your video content will get played: the title, the description and the video thumbnail. When the video is embedded on a page, there is only one way: the video thumbnail. That’s it.
So the thumbnail has to work hard. It needs to first catch their attention and then give them a reason to watch. To do this, a lot of YouTubers have discovered that including these four elements in a custom video thumbnail can make the difference:
- It’s simple: Remember that in some contexts, it’s going to be very small. In Google search results, it may just be 160 x 90 pixels. So keep it simple. Shrink it down to that tiny size and see how it looks.
- It has a face: They are an all-powerful type of image, with a unique ability to catch attention. From the time we are infants, we are predisposed to looking at faces.
- It contains the headline: Give them some indication of the topic and they are more likely to click. Usually this means embedding the headline into the video thumbnail itself.
- It’s colorful: Any type of visual contrast will help attract attention. Although this isn’t as important when embedded on a blog post, it can make all the difference on YouTube or on Google.
Put those together and you’ll get a thumbnail that looks something like this …or like the video thumbnail at the top of this post.
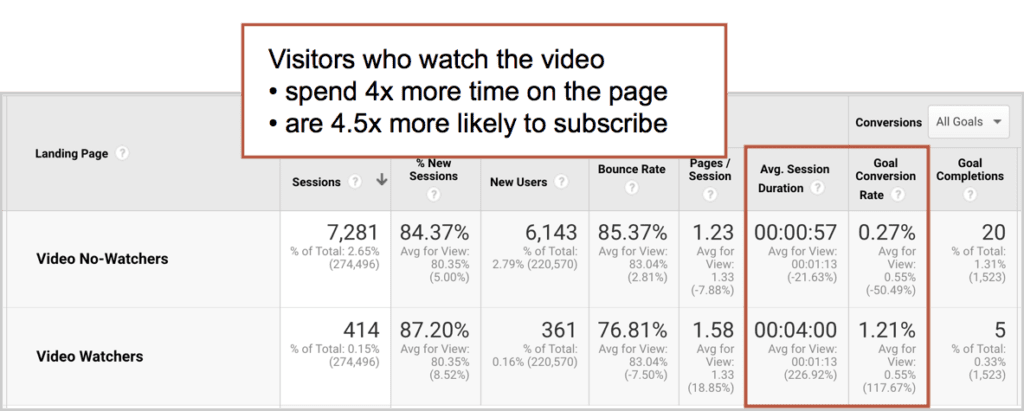
11. Email conversion rates: Embedded videos
Not all of the visitors to your content marketing will watch the embedded video. But those who do are more likely to stay longer and more likely to subscribe to your newsletter.
If you track video views in Google Analytics (set up manually through GTM for Universal Analytics, set up for you in GA4) you can see the conversion rates from visitor to subscriber for those who do and don’t watch the video. In our experience with embedded YouTube videos, the difference is big.
Here’s our data and the process for tracking this on your website.
How visuals drive lead generation
Here we are at the bottom of the funnel. This visitor is on the homepage or a service page, so they’re far more likely to become a lead. Maybe they heard about you from someone. Or they searched for a commercial intent keyphrase.
How do marketing visuals drive lead generation?
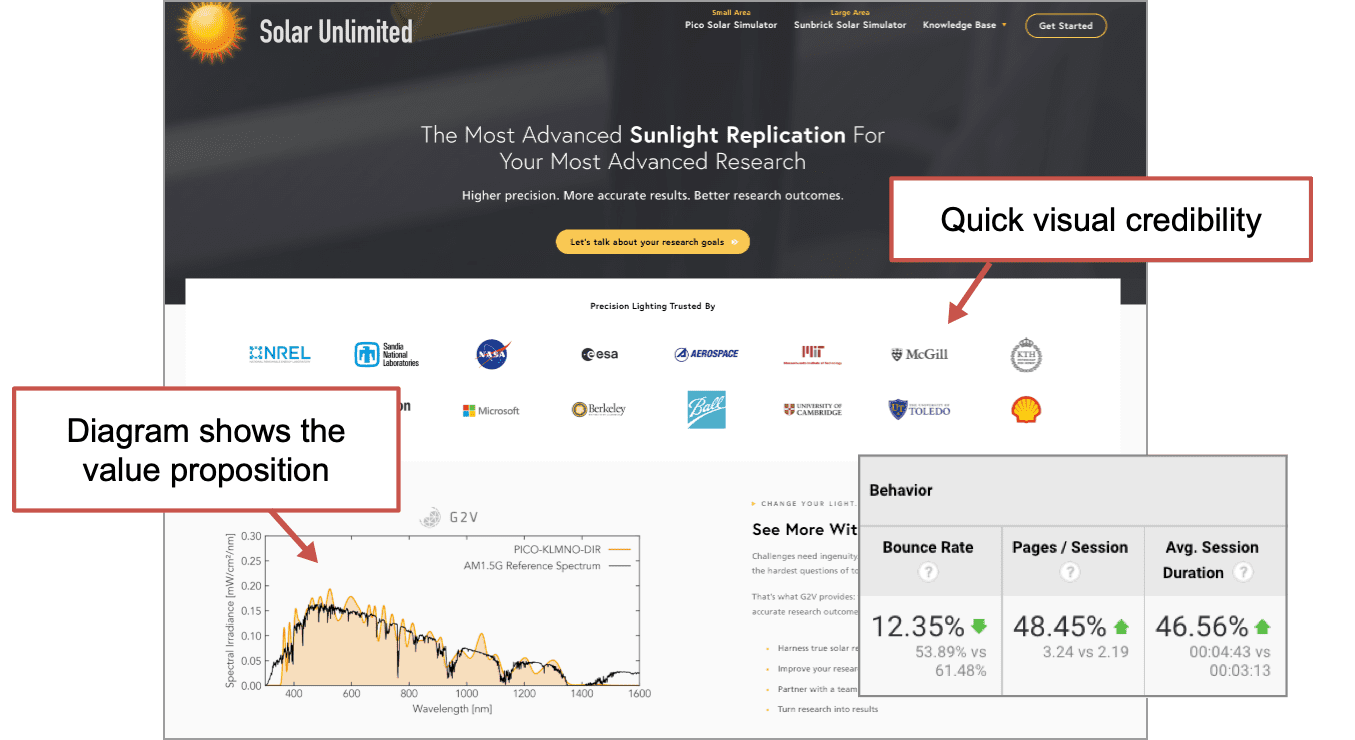
12. Bounce / Engagement rate: Trust seals, diagrams
Every webpage has a visual hierarchy, whether it was deliberately planned or not. When the top of the hierarchy includes trust-building elements, it creates instant credibility.
This example includes two types of conversion-focused visual elements:
- Client logos
Not everyone has worked with these companies. Showing these sets you apart from competitors and indicates you’re legit. Also effective for quick credibility: as-seen-in media logos, award badges, certifications, partner logos and memberships. Together, these are often called “trust seals.” - Visual depiction of the value
If there’s a diagram that shows the value of your work, put it here. If there’s a chart that shows how you’ve done it more or how do it better, add it. The visitor is more likely to see and believe the value if it’s an image or video. The idea is to both show and tell.
Together, these visuals communicate quickly while differentiating you from competitors. You can measure the impact in your behavior metrics.
13. Conversion rate: Faces near CTAs
Here is one last way to manage your website’s visual hierarchy and guide the eyes toward conversions: put faces near calls to action.
The magnetic power of face images can pull their attention toward the CTA. And if that call to action sounds like a low commitment (ie “chat with an expert”) then the visual may make the difference. Compare:

Showing your people is another way to differentiate your company since you’re the business with those people (stock photos don’t count). They help make a personal connection. But a lot of businesses hesitate to add pictures of their teams to their websites.
Little companies are always trying to look big.
Big companies are always trying to look smaller.
Really, every business should just be more human.