Video…
It’s a powerful component of a content strategy.
It can have a big impact on engagement.
Analytics…
It’s how we know the behavior of our visitors.
It can inform decisions for ever-better performance.
But how do you track video views in Analytics?
More specifically, how do you track embedded YouTube videos using GA4?
This post gives you step-by-step instructions for using GA4 to measure the impact of your YouTube videos in your content marketing program.
- Confirm that video views are being tracked in GA4
- Create a quick GA4 exploration to compare viewers with non-viewers
- Example of analysis using the data from that GA4 exploration
If you’d like to sit back and watch rather than read, here’s everything in a video:
Note: this process is specifically for tracking YouTube video performance in GA4. We believe that YouTube is the best place to host and stream content marketing videos for several reasons. To track visitor interactions with embedded Vimeo videos (or other video players), you’ll need to use Google Tag Manager and a library specific to your video player. Follow these instructions.
Let’s confirm that GA4 is tracking your YouTube videos
Good news!
GA4 tracks YouTube video views by default, at least for embedded YouTube videos. No setup is required. No need to use Google Tag Manager.
 |
Krista Seiden, Founder KS Digital“I love this because I think it helps to democratize data and ensure consistent tracking across websites for video tracking and other Enhanced Measurement events. With Explore reports such as Funnels and Free-form, you can take this out-of-the-box data and create reports that will really help to move your business forward.” |
Here is how to confirm that GA4 is tracking video views:
- Go to the Admin section by clicking the gear in the bottom left
- In the Property column, click on “Data Streams”
- Click on the Data Stream for your website
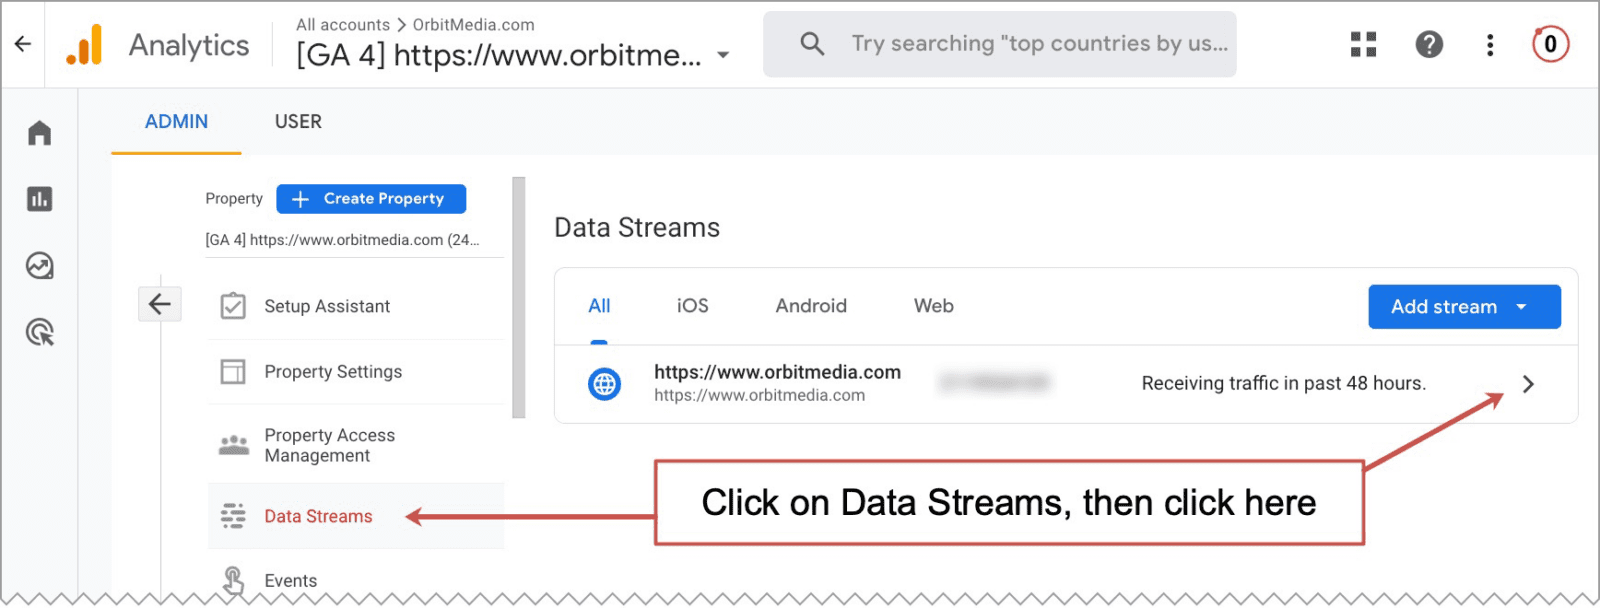
- In the “Enhanced Measurement” section, the blue toggle switch should be turned on. Click the gear on the right.
- Now you’re looking at all of the Enhanced Measurement settings. Confirm that the blue toggle switch next to “Video engagement” is turned on.
- If you made any changes, click “Save”
![]()
ProTip: While you’re in here, make sure that everything is turned on. This is where you tell GA4 that you want to track scrolling, exit clicks, site searches, file downloads, etc. Very very useful!
Notice that with GA4, it’s no longer necessary to have to create events using Google Tag Manager. That little switch is all you need to track videos on your website. If it isn’t turned on, you aren’t tracking your videos.
There are three video-related events:
- video_start (triggered when the visitor clicks play on a video)
- video_progress (triggered when video progresses past the 10%, 25%, 50% and 75% durations)
- video_complete (triggered when the video ends)
To read more about video event tracking, the triggers and parameters, here’s Google’s documentation for GA4 Enhanced event measurement. But you don’t really need to know all the technical details to do basic YouTube video tracking.
 |
Jeff Sauer, Data Driven University“Once this tracking is in place, you can unlock a whole new level of insights into how video impacts and improves content marketing. By using exploration reports and even developing audiences based on videos watched, you can perform multiple levels of analysis.” |
How to measure the impact of video using a GA4 exploration
The impact of video on a content strategy is happier visitors. When visitors spend more time on a page, we can measure that in GA4.
Videos may also make your brand more memorable and trustworthy, but those aren’t things that show up in Google Analytics reports. So we’ll settle for website engagement.
Step 1: Click on Exploration > Blank Exploration. It’s always nice to start fresh.
Step 2: In the top left, name the exploration. I’ll call mine “Video Impact.”
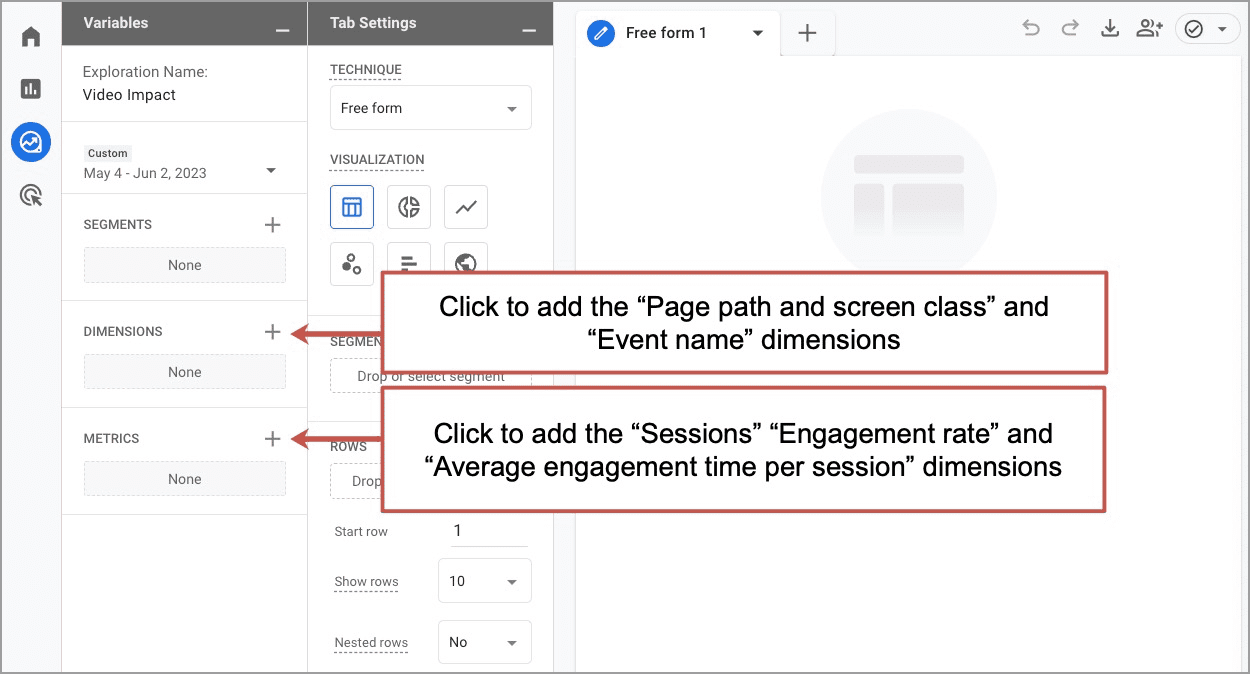
Step 3: Click the ‘+’ next to DIMENSIONS, search for and select the “Page path and screen class” dimension, then click “Import”
Step 4: Click the ‘+’ next to METRICS, the search for and select “Sessions” “Engagement rate” and “Average engagement time per session” metrics, then click “Import”
We like engagement rate because it’s more meaningful than the old bounce rate metric. If you need a benchmark, our research found an average engagement rate of 55% across all traffic sources.
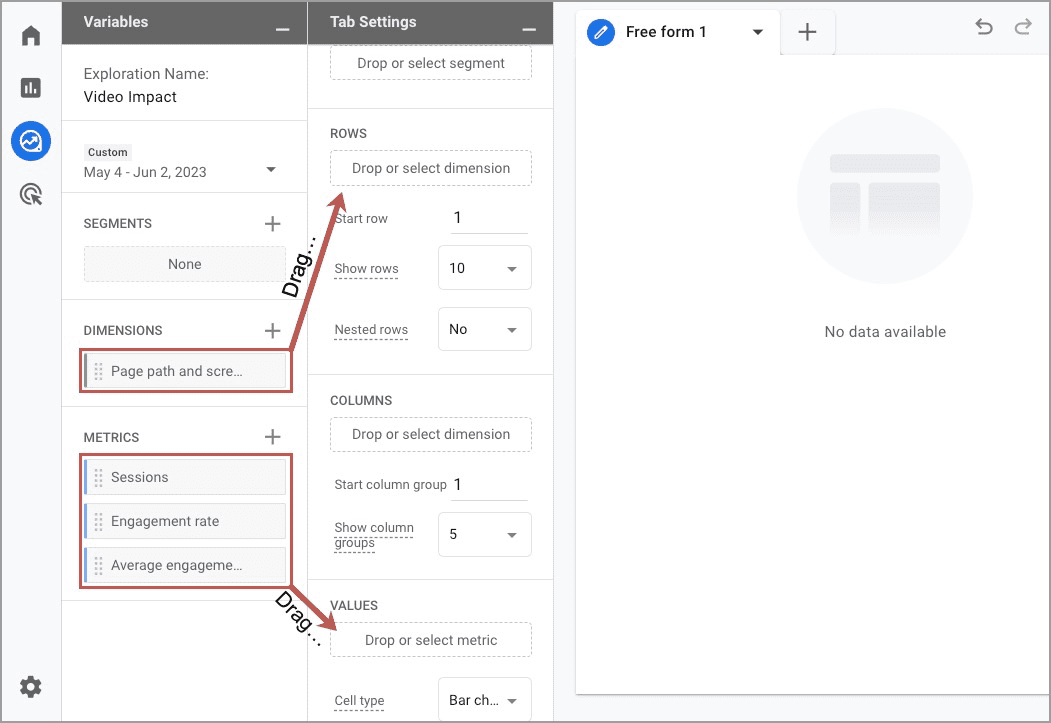
Step 5: Drag and drop the “Page path” dimension into the ROWS box and all of your metrics into the VALUES box
Now you’re looking at a report showing the pages with videos as rows and the activity on those pages as columns. That’s nice, but really, we’re trying to measure how video impacts engagement.
For that, we’ll need to create two segments, one for visitors who watch the videos and another for visitors who don’t. Then we can compare.
Step 6: Click ‘+’ next to SEGMENTS and the click “User segment”
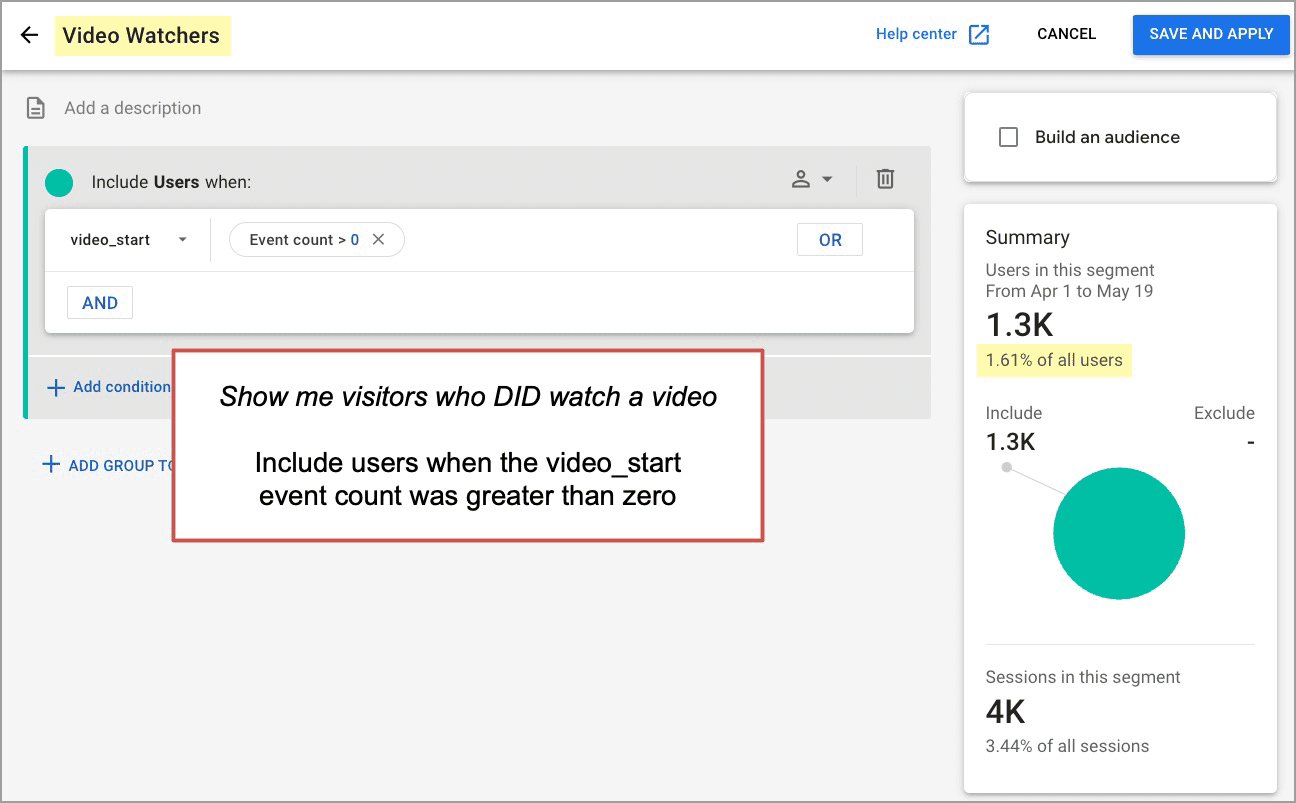
Step 7: Name the segment. I’ll call mine “Video Watchers.”
Step 8: Set the segment to Include Users when video_start is greater than zero. This segment will only include data for visitors who triggered the video_start event.
Note: This works even if you don’t set the event count to zero. Just pick an event and GA4 will assume that you want to see the users who triggered that event. So helpful, this Analytics tool!
Your GA4 segment should look like this:
Notice that even before you save the segment, there is interesting data here. On the right, you can see what percentage of all of your users clicked a play button. In this account, it’s 1.6%
Step 9: Click “Save and Apply”
Next, we’ll make the second segment for visitors who didn’t watch any YouTube videos.
Step 10: Click ‘+’ next to SEGMENTS and the click “User segment”
Step 11: Name the segment. I’ll call mine “Video Non-Watchers.”
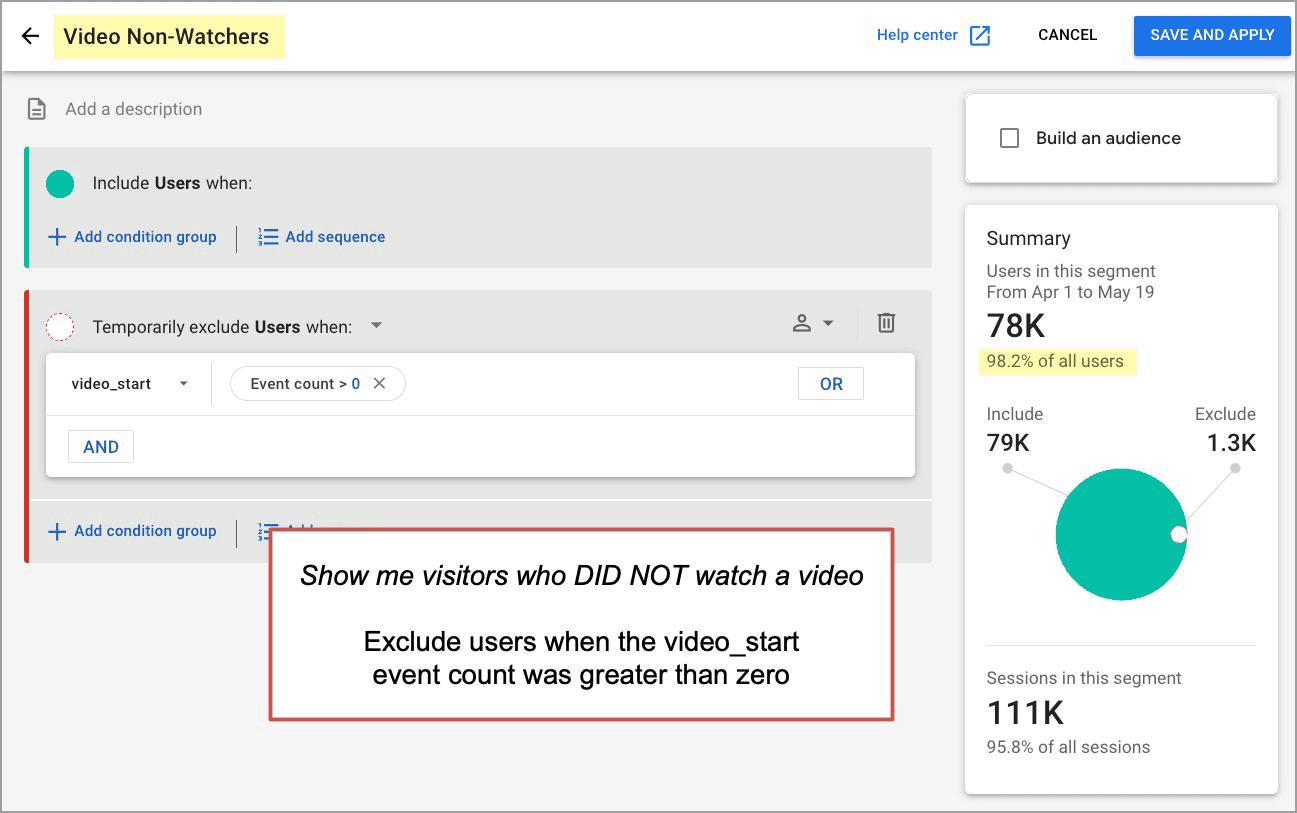
Step 12: Set the segment to Exclude Users when video_start is greater than zero
This segment will only include data for visitors who did NOT trigger the video_start event. You’ll need to click “+ Add condition group” button in the red exclude box and click the garbage can button in the green Include box.
Your GA4 segment should look like this:
Notice the mini report on the right. In this account for this date range, 98.2% of visitors didn’t watch a video.
Step 13: Click “Save and Apply”
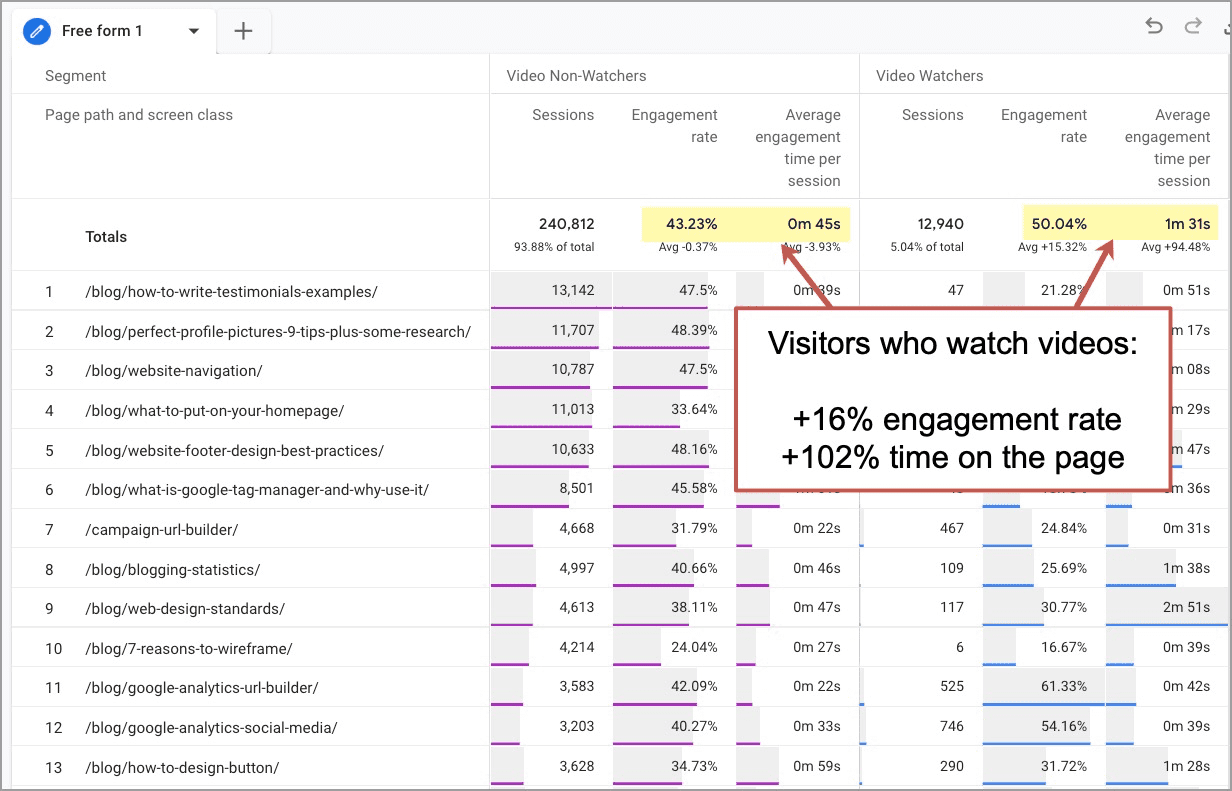
All set! Now the report shows two groups of columns, one for those who watched a video and one for those who did not. If you don’t see much data, choose a longer date range.
Impact of video at the website level
We can now see the impact of adding YouTube videos to your website. We can answer the question about the value of YouTube and content strategy with data:
Are visitors who watch videos more engaged?
- Visitors who watch videos have a 16% higher engagement rate
- Visitors who watch videos spend twice as much time on the website
Clearly, these YouTube videos are making a difference in website engagement. In our content program, we’re doing 12-minute videos that take around 4 hours to produce. So knowing the actual impact is important.
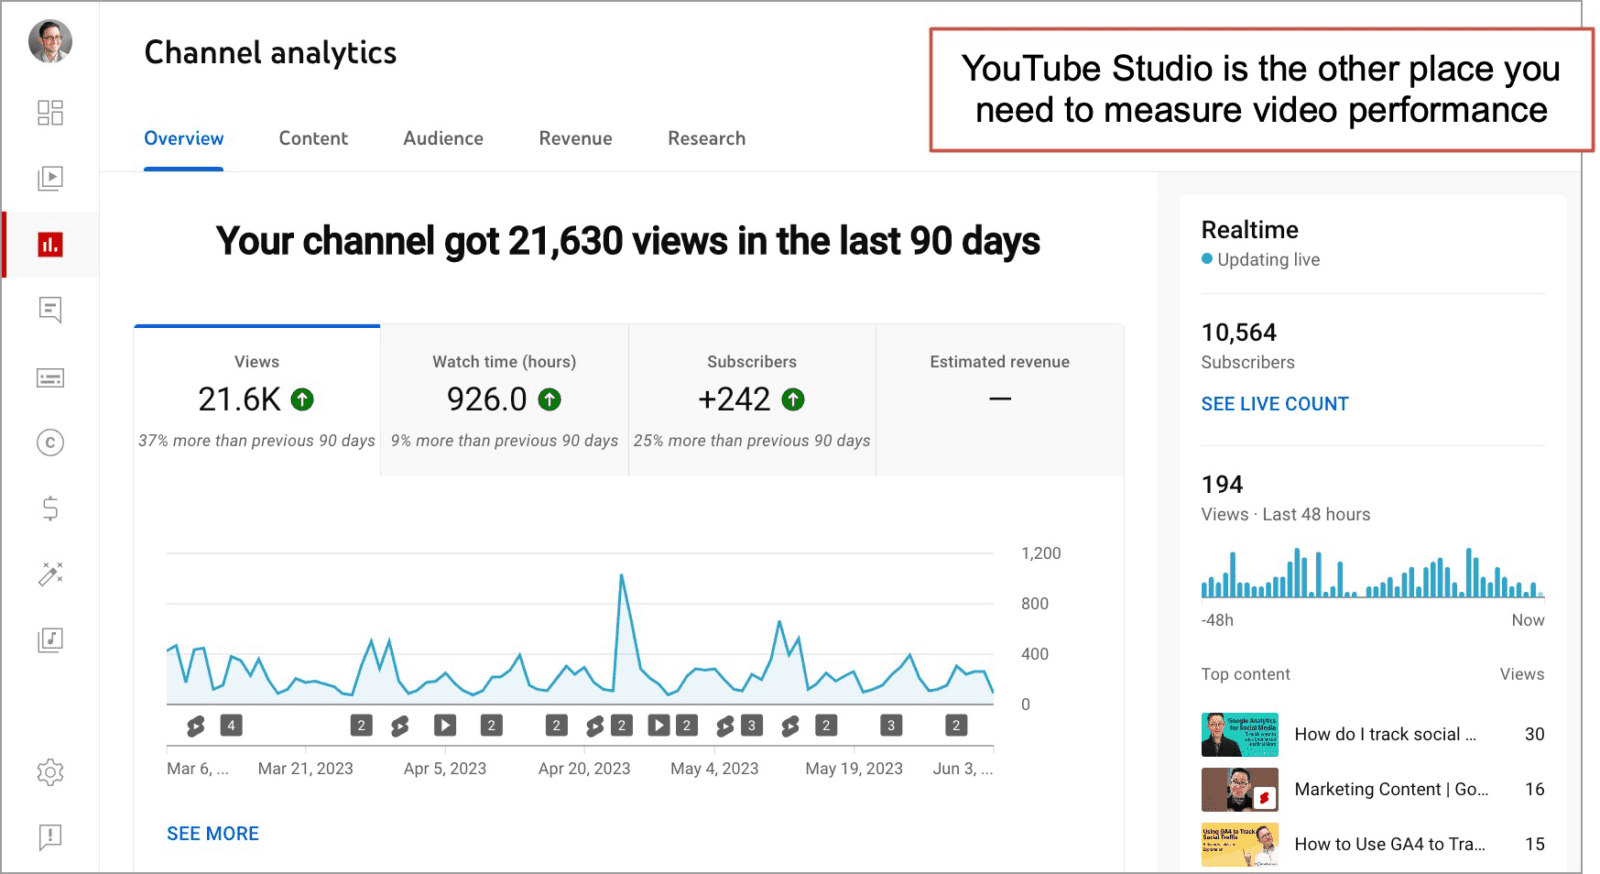
Beyond website engagement, these videos drive off-site visibility. These videos often rank in Google and on YouTube itself. Some viewers subscribe on YouTube and never visit the website.
YouTube Studio is necessary for a complete look at the impact of these videos. Here’s what YT Analytics looks like for our YouTube Channel:
Impact of video at the page level
Of course, the high-level report is never as interesting or useful as the data one level deeper. Let’s do some analysis of some recent posts.
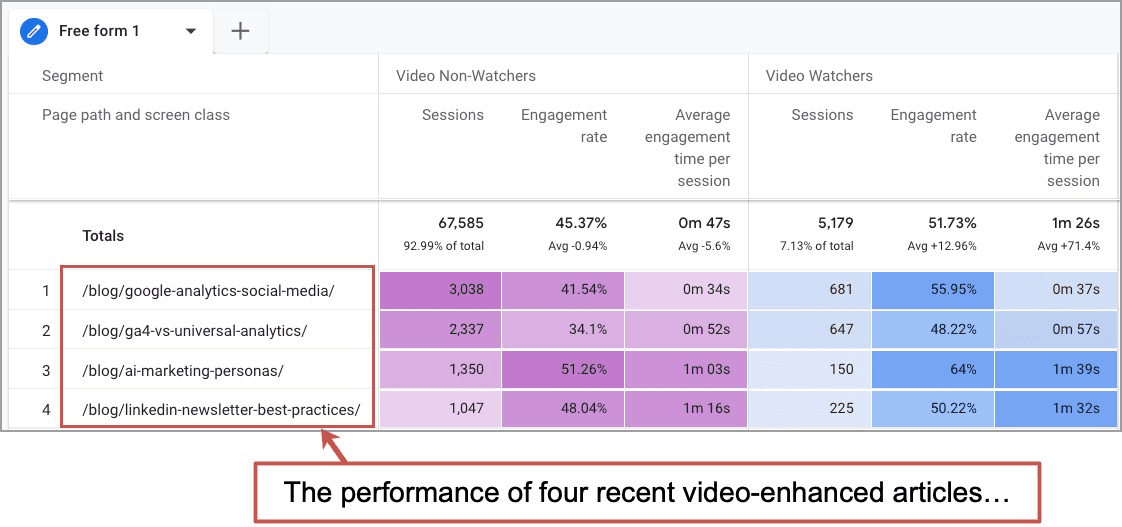
On this blog, my last four articles have included video versions of the content, embedded as YouTube videos high on the page. Our idea is to keep differentiating our content from lower quality or AI-generated content.
Let’s look at the performance of those specific video-enhanced URLs.
I’ve removed the other rows by right-clicking on them to “Exclude selection” from this report. I’ve also changed the cell type to heat map because it looks nice.
Looking closer at the content, I spot a few correlations, confirming some patterns we’ve seen across all of our articles and videos.
- More people watch the video when we add [VIDEO] to the header
- More people watch the video when we put the video above the fold
- Videos for the technical how-to topics are more popular
Clearly, I need to focus on videos for technical topics, keep them high on the page, and always add [VIDEO] to the headers and email subject lines for these articles.
Next steps for deeper analysis
I could go on and do more analysis, find more patterns and make ever-better decisions. Here are a few examples of YouTube video tracking using GA4 that come to mind:
- How does video engagement differ for mobile and desktop visitors?
Add “Device category” as a column - Are your videos getting watched more on your website or on YouTube?
Compare video_start metrics in GA4 to views YouTube Analytics - Which videos are getting watched all the way through?
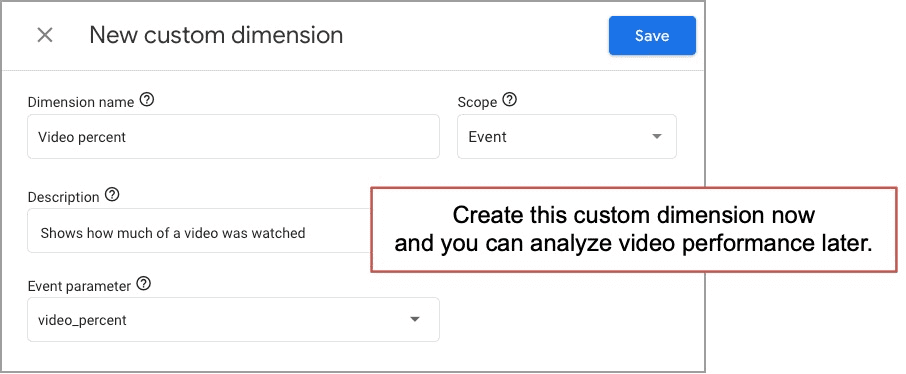
Here you can report on the performance of specific videos using Video title as the dimension. You’ll need to first add video_percent as a custom dimension then create a new exploration using video_title as rows and video_percent as columns
For that last one, you’ll need to create a custom dimension and wait a while while it gathers data. It’s not really a custom event since the parameter is built into GA4.
You can do that from the Admin > Custom Definitions section. Click “Create custom dimensions” and use the following settings.
Imagine how useful this deeper analysis could be. Imagine all of these insights on a single GA4 dashboard.
Lights, Camera, Tracking!
Embedding video content is easy. YouTube video tracking takes a bit more work. But it’s worth it.
Now, you can measure the impact of embedding YouTube videos into articles (reporting).
And better yet, you can get ideas and insights into how to make those videos work harder (analysis).
And finally, you’ve leveled up your GA4 skills
Tell a friend and ask them to endorse you for GA4 on LinkedIn. 👏
(if I am your friend, ask me!)

