Some content gets real results.
Some content …not so much.
This is obvious to every marketer who’s pushed the publish button. But it’s less obvious that content performs in two different ways.
Some content is good at winning clicks and attracting visitors. Some content is better at holding attention and engaging visitors.
If we make a 2×2 quadrant with traffic (high/low) on one axis and engagement (high/low) on the other, a matrix appears.
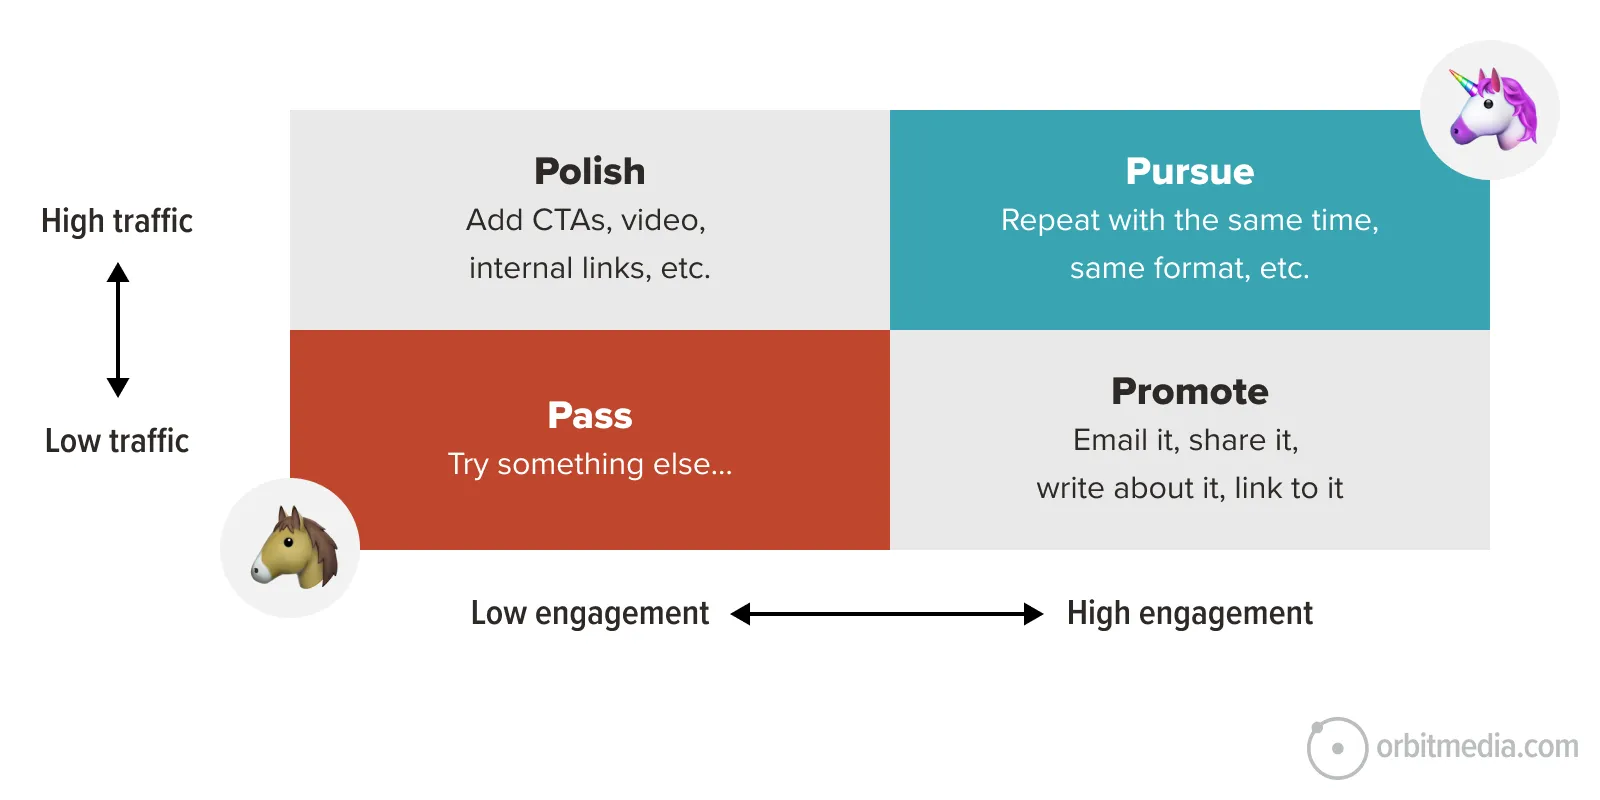
This little chart shows the four outcomes from everything you’ve published. Not just winners and losers, but the ways in which they are winning or losing. The insights are easy to spot:
- High-traffic, high-engagement …PURSUE
These are the outperformers. You want to repeat these successes. These are your unicorns. 🦄 - Low-traffic, high-engagement …PROMOTE
These ones that people love, but almost no one sees them. - High-traffic, low-engagement …POLISH
These bring loads of visitors who do nothing for your business. - Low-traffic, low-engagement …PASS
These had basically no impact whatsoever. These are your donkeys. 🫏
Years ago, Larry Kim taught that everything we do in marketing is either a unicorn or a donkey. And the purpose of analytics is to help us find those unicorns so we can go make baby unicorns.
How to find your content performance in GA4
In a single GA4 report with just a few customizations in, you can see the performance of your content with your readers. Here’s how to make it:
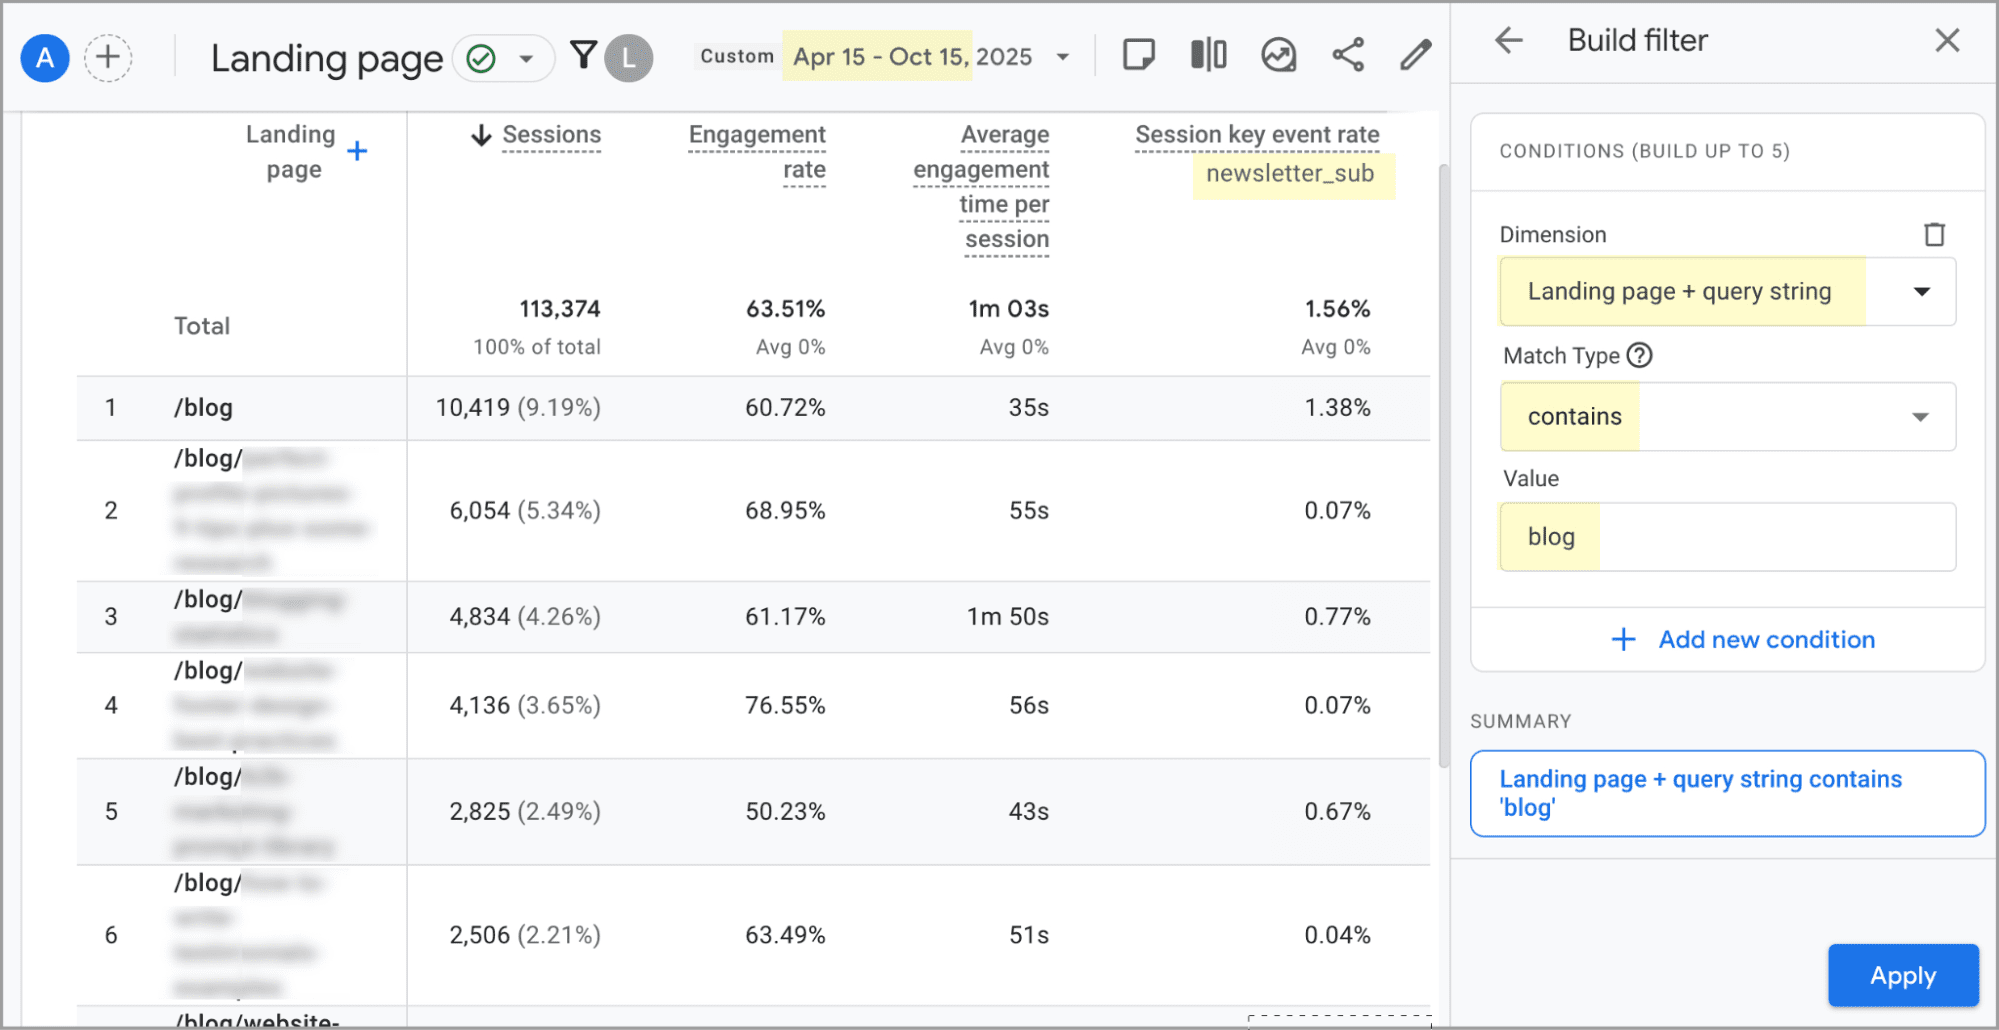
- Go to the Engagement > Landing Pages report
- Set a nice long date range
- Click “Add Filter” and set the filter to “Landing Page… Contains… blog” (or whatever the name is for your folder where you content program lives)
- In the key event rate column, set the goal to newsletter signups (hopefully, your goals are set up correctly. If not, scold your web partner)
This screenshot shows all of those settings. Just make your report look like this:
Note: If you don’t like the order of your columns, you can rearrange them by clicking the pencil icon in the top right (you’ll need editor permissions) and customizing the order of the metrics.
See the numbers at the top of the columns for engagement rate and average engagement time? Those are your benchmarks. Every article is above or below that benchmark.
Reminder: an engaged visit is a visit that was 10+ seconds or 2+ pages. GA4 pros memorize that definition!
How to analyze that data using AI
You can manually dig for insights. Or you can let AI do that for you. It’s easy. Export the report as a CSV file (click the share icon in the top right) and upload it to your favorite LLM. We recommend that you delete the top nine rows of any export from GA4 because they’re comments and AI doesn’t need them. You can also delete any useless columns.
Here’s the Performance Matrix Generator Prompt that goes with the upload.
You are a data analyst helping me visualize blog landing page performance. I will upload a CSV export from GA4 that includes columns such as Sessions, Engagement rate, Average engagement time per session, Session key event rate, and Key events. Your task:
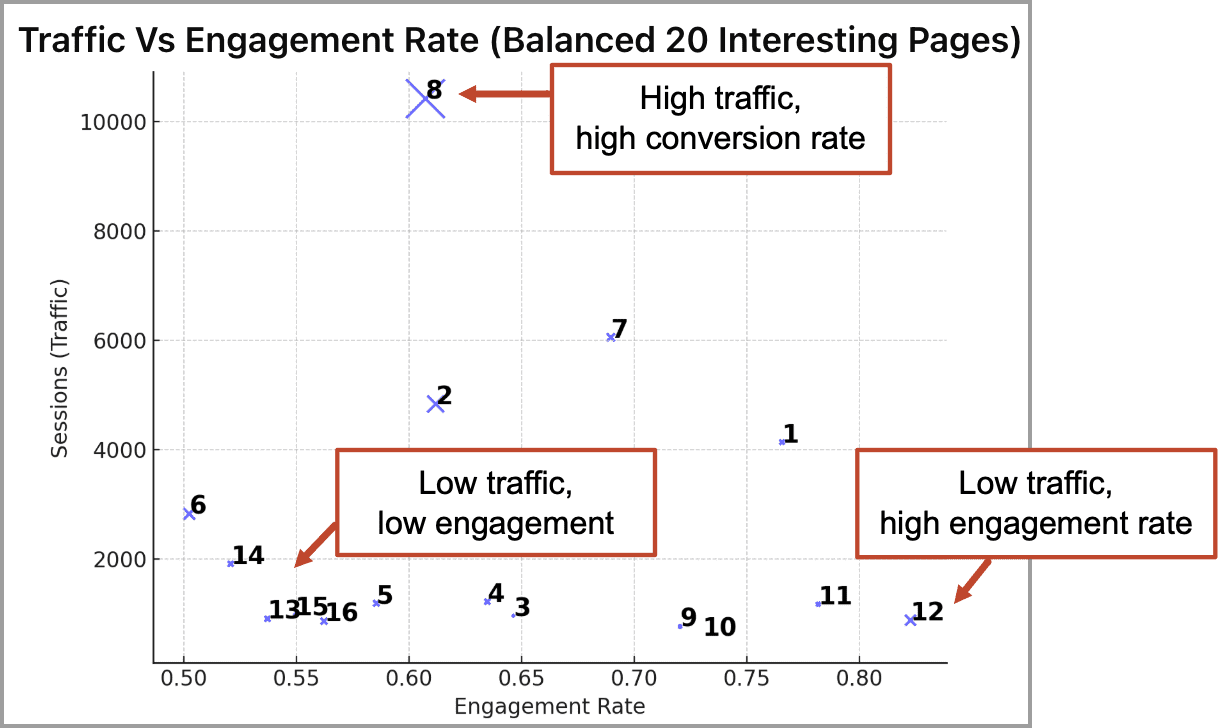
1. Load the data and remove anomalies such as rows with very low traffic (under 500 sessions) or unrealistic engagement rates (above 0.98). 2. Normalize the data so that traffic and engagement are both scaled from 0 to 1. 3. Create a scatter plot with Engagement rate on the X-axis and Sessions on the Y-axis. Each dot should represent a landing page. Use Key events for bubble size. 4. Select about 15–20 of the most interesting rows so the chart is easy to read. Prioritize a balanced mix of: 5. Label each point with a simple number and show a small summary table listing Sessions, Engagement rate, Key event rate, and Key events for each numbered row.
At the end, explain what each quadrant means and highlight which pages are outperforming or underperforming based on both traffic and engagement.
It works pretty well. I told the AI to just use the row numbers to make it easier to read. I can reference them myself in the CSV.
This prompt also adds an X for each post. Larger X’s mean a higher conversion rate (newsletter signups). So there are three data points for each article.
Now that you know which articles work how well in which ways, it’s time to decide what to do about it. We suggest the following next steps:
Pursue: Your Top Performers
These are your unicorns. They are above baseline in both regards: traffic and engagement.
What to do next with your top performers?
Now that you’ve rounded up your unicorns, look at them closely. What do they have in common? Why did they work so well? Can those successes be repeated?
Find the pattern, then pursue it. Adapt your content strategy to prioritize that format, those topics, those promotion tactics.
They’re likely driving 80% of the awareness and new subscribers. So your primary goal is to create more content that lands in this corner of the performance matrix. Even a few more can make a huge difference.
Example: Stan’s Lab Safety Blog
Stan’s blog used to cover a lot of topics, but then he realized that the safety articles get the most traffic. They also have 20% higher engagement rates on average. So Stan commits to publishing a new safety checklist every month. He changes his email sign up CTAs to promise safety tips. He puts all of his safety checklists into a new blog category.
Polish: Your High-Traffic / Low-Engagement Content
If brand awareness is the primary goal, these pages may be a big success. No one has ever clicked on an outdoor billboard, how are these posts any different? What’s wrong with 2,000 extra visitors per month?
But if you’re looking for visitors who take meaningful actions, these visits are a frustration, especially when the article often has very little to do with the business. A lot of content programs have posts like this. Usually, it’s a “random ranker.”
It gets a ton of traffic from an irrelevant phrase, searched by purely information intent visitors. It’s a common story. They search… you rank… they click… they land… they linger… they leave.
What to do with that old article that gets a lot of random traffic?
Sadly, there are not many ways to squeeze more value from these pages. It’s difficult to convert blog traffic. The visitor’s intent is so low, their interest so fleeting, that almost nothing will entice them to click on anything.
But it doesn’t hurt to try…
Add internal links to high engagement rate articles
- Add a call to action to a product/service page
- Add a gated guide that goes deeper into the topic
- Add an embedded YouTube video (this may pump up the views, improving your YT metrics)
The general idea is to either improve the user experience or intercept the visitor and guide them toward a page where they’re more likely to engage or act.
Example: Stan’s Laboratory Signs Article
Years ago, Stan wrote a blog post about laboratory signs, which told the history of the radiation symbol. It’s ranked high for “radiation symbol history” ever since, attracting 100+ visitors per day. These visitors never click on anything but the back button. So Stan adds internal links from the article to his products, internal links to other articles and a popup to subscribe to his newsletter. He thinks about adding display ads to the page but ditches the idea.
Promote: Your Low-Traffic / High-Engagement Content
Readers loved it! …it just didn’t have many readers. Most websites have these: strong assets with weak visibility.
There are fundamentally two jobs in content marketing: create quality content and promote that content however you can. The former is important; the latter is critical. It’s impossible to overstate the importance of distribution and promotion.
The best content doesn’t win. The best promoted content wins.
What to do with low-traffic, high-engagement content?
Promoting an older, high-quality article will often drive better results than creating a new article.
- Share it on social media again …and again
It was a popular post at the time, but that was years ago. Even then, it’s likely that most of your followers didn’t see it because organic reach in social media is low (3 – 5% of a following). Share it monthly for the next three months. Or boost it with a small budget. It might be worth it. - Send it as a newsletter again
If it’s been a year or more, your subscribers won’t notice that it’s the same article. Unless you have 100% open and CTRs, some of them didn’t see it the first time. And even if they all clicked it, what about your new subscribers?Give it a new subject line. Maybe freshen up the article. Then hit send. - Rewrite it for another website
Guest posts are the only posts that promote themselves. They are automatically in front of new readers. Rewrite it from a new angle, link back to the original and pitch it to a relevant blog. It will drive more awareness than actual traffic, but the link may be valuable.Tip! The “evil twin” is a rewritten version of an article that takes the negative angle. (example “best practices” becomes “biggest mistakes”) Editors love them so they’re easy to pitch. - Rewrite it with stronger keyword focus
It’s possible that the article already ranks, but doesn’t yet rank high. If so, you have an awesome opportunity to create a lot of durable visibility. Carefully follow this step-by-step process for using Google Search Console to find those striking distance phrases. Sharpen the focus of the article to better target those phrases. - Syndicate it
If you simply copy and paste the article (or excerpts of it) into LinkedIn, it will reach a new audience. Add a call to action back to the original and you’ll see the impact in your Analytics. Substack and Medium work the same. You can also post sections of the article on Quora in response to relevant questions, and link these back to the original. - Put it on your homepage
Why not leverage the traffic you already have? If you feature content on your homepage, this is the perfect place to promote your strongest pieces, even if they aren’t new. Far better to use your homepage to manually curate your best, rather than just show the latest.
These are just a few items from our big list of 76 ways to promote content. Really, anything from that list will make it more visible.
Example: Stan’s “Layout for a Safe Lab” Guide
It started as a little diagram, but Stan eventually made it into a set of detailed visuals, showing how to design a safe laboratory (where to put the eye wash station, fire extinguishers, etc.) It didn’t get much traffic, but it got shared a bunch and people still mention it to him.
In less time than it takes Stan to write a new article, he updates this old post. It was light on text, but still ranked for “safe laboratory design.” He adds 500 words of detailed explanation. He also rewrites it as “Dangerous Lab Layouts: 5 Serious Safety Mistakes” and pitches it as a guest post to a trade publication. They accept it and the link helps his rankings.
Pass: Your Low Traffic / Low Engagement Content
Marketing is about making tough decisions. You have to know when to say when.
The fourth and final quadrant in our content matrix is for the lowest performers. They failed at both attracting and engaging visitors. These posts are like bad cheese on broken mousetraps.
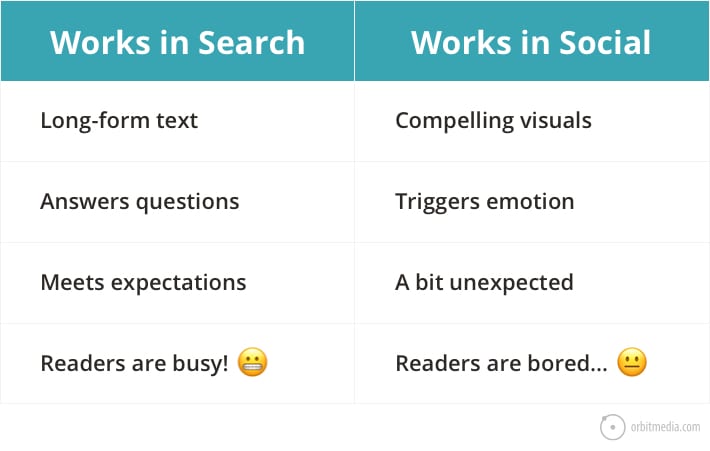
Maybe you shared it on the socials, and the engagement was so low, you checked your internet connection. But be careful drawing quick conclusions from a single promotion channel. That post that failed in one channel may do well in another. Some topics may be terrible for social, but great for search. Others, vice versa.
But we’re also talking about the content that fails to impress after the click. These articles have low engagement rates and low average engagement time and low conversion rates.
Why? Maybe it has a boring headline. Or maybe the entire thing is boring. It’s not original or novel in any way. Few visuals. No contributor quotes. Weak assertions. Shallow depth.
What to do with your lowest-performing content?
Nothing.
I have close friends who disagree with me on this. But I recommend paying no attention and spending no time on these articles. Move on.
Should you delete it? I wouldn’t bother. You might break links on other pages. True, some SEO believe that pruning content is good for your search rankings, but I’ve seen no solid evidence of this unless it’s a very large website that pushes Google’s crawl budget to the limits.
 |
Chris Carr Farotech“The true art of content refinement is to have the courage to actually pass on the content you actually believe in. Marketers who say YES to everything often pump out a lot of ‘meh’ content that doesn’t convert, doesn’t drive inbound links, and often leaves you feeling deflated. Instead, remind yourself that every time you say NO to poor performing content that you might be emotionally invested in, you are saying YES to adding time and energy to good content that has the potential to be great.” |
Example: Stan’s Product Reviews
Back when Stan didn’t know what to write about, he decided to write a weekly review of a product he’s using. Each review would take a few hours, and they were posted on his how-to lab safety blog with everything else.
But they never did well. His subscribers love those safety tips, not the product reviews. Anyone looking for a product review could find hundreds of them on the big retail sites. He finally looked at the data and realized, these posts were a cost with no benefit. He gave up and put that time toward a monthly safety video for YouTube.
It’s a simple framework for analysis of anything
80% of the results come from 20% of the efforts, so they say. Evidence of the results are in your data, and it comes in several flavors. And AI can help you with the analysis.
What else could you apply this to? Here are a few quick ideas.
- Email campaigns: Plot open rate vs. clickthrough rate to find which emails attract attention versus which drive traffic.
- Landing pages: Compare sessions vs. form submissions to spot high-traffic pages that don’t convert and low-traffic ones that do.
- Ad campaigns: Map impressions vs. conversion rate to find ads that perform efficiently—not just those that spend the most.
- Social posts: Compare reach vs. engagement to identify the “quiet hits” that deserve reposting or boosting.
- Lead sources: Plot volume vs. close rate to visualize which sources bring in quantity versus quality.
If you can find and export the data, AI can help you find those donkeys and unicorns. Let’s ride.

