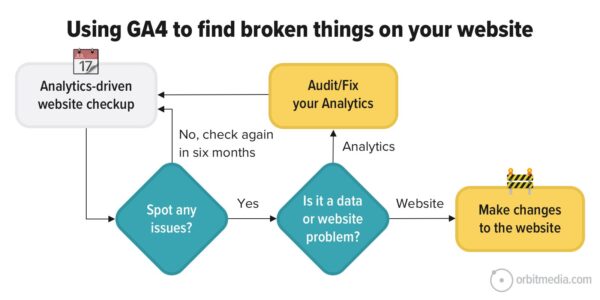
Finding opportunities. That’s what Analytics is all about, right? Find what’s working and then double down on that approach.
But you can also use GA4 to see if there are bugs, if anything is missing, if anything is broken. It’s a super fast way to audit your website.
You can often find big problems in just a few clicks.
We’ll do everything using GA4 reports and exploration, mostly by referencing User > Tech details dimensions (ie. browser version) for various engagement metrics (ie. engagement rate). That might sound fancy, but it’s really not. The step-by-step processes are right here.
Here is a 7-step GA4-powered website audit. It’s not a replacement for detailed testing, but GA4 is a fast, efficient and free audit tool. You are just clicks away from the answers to each of these questions.
- Are there broken pages or bad URLs?
- Are there broken internal links between your pages?
- Is your site working well in every browser?
- Is your shopping cart broken on certain browsers? (ecommerce)
- Is your site not working on some devices?
- Is there a sudden drop in traffic?
- Are there searches with no search results?
To make this guide easy, we’ll use a Q and A format. Each section is a question. The report with the answer to the question is listed next. Each section ends with a checklist for next steps.
1. Are there broken pages on your website?
Engagement > Pages and Screens > “Page title and screen name” dimension, search for “Page Not Found”
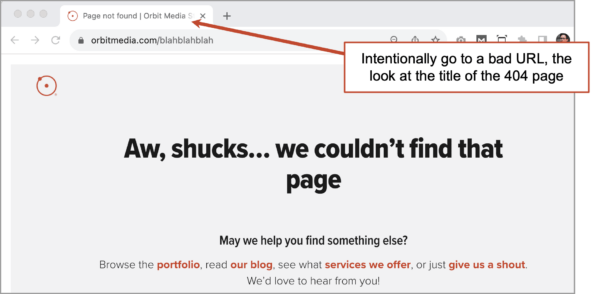
If a visitor goes to a bad URL (a page that doesn’t exist) they arrive at a “404 Page Not Found” landing page.
Although visits to these non-existent URLs appear in your Pages and screens report under “Page path and screen class,” they all have different URLs, making them hard to find.
But they all have the same Page Title.
So find the title of your 404 page by intentionally going to a bad address on your site, such as www.yourwebsite.com/blahblahblah.
ProTip: Enter your domain then let your cat jump on your keyboard. Or if you’re working from home with a kid on your lap, let them help.
Now look at the title in the browser tab. See it? On this site, it’s “Page not found.”
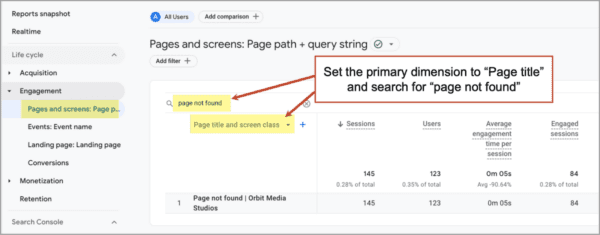
 Now in Analytics, go to the Engagement > Pages and screens report. Set the primary dimension (the dropdown above the first column) to “Page title and screen class.” Then enter the page title to the search bar above the first column.
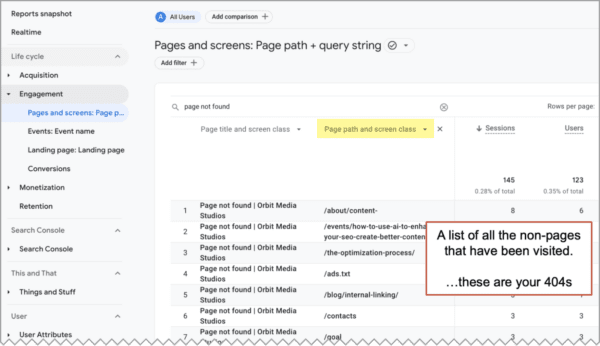
You should now see a report with just one row. Next we’ll add a secondary dimension to see the URLs. To do this, click the little blue plus next to the primary dimension dropdown and search for “Page path”
You’re now looking at a list of all the bad addresses that have had at least one pageview during this date range.
These are your 404’s.
 Next steps:
- Redirect traffic from these pages to the most relevant page (tell your web dev partner to make some 301 redirects).
- Or create content on these URLs!
- Make your 404 page awesome. Why not? Add links from it to other web pages. Add humor. Create an apology video. Or get really creative, like these examples:
Next question: How did people get to these pages? Was it from internal links?
2. Are there broken internal links on your site?
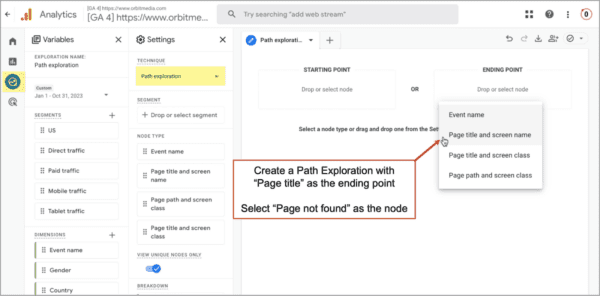
Path Exploration > Ending Point: Page title and screen name “Page not found”
Are you the one driving traffic to these bad pages? Are there broken internal links on your website? Our GA4 website audit has the answer.
For this, we’ll use a Path Exploration report.
- From the Explore menu, select Path Exploration
- Click the “Start over” in the top right corner
- Click in the “ENDING POINT” box and select “Page title and screen name”
- Search for and select “Page not found” or whatever the title is of your 404 page
 If you don’t see anything, try a longer date range. The report will show you pages that visitors flowed through on the way to the bad URL. These pages probably have broken links on them, or at least they did at some point during the date range.
Next steps:
- Find the broken link on the page
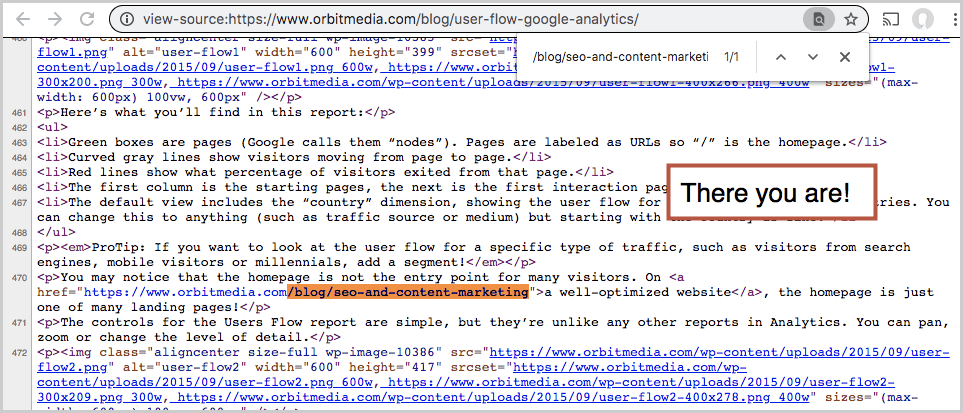
If you have trouble finding the broken link on those pages, you can view the source code of the page (by right clicking anywhere on the page and clicking “view page source” from the menu) and then using the find feature (control + F) to find the bad address in the code. - Remove the link or update it to point to another page
You can use these internal linking best practices to find the opportunities with the best SEO value.
 Because GA4 is based on website behavior, this will only show links that are broken and clicked on. In other words, the links that actually affect user experience. If it’s never been clicked, it won’t show up.
ProTip: Use a paid SEO audit tool, which will check your site for all broken links (internal and external) along with other stuff that technical SEOs worry about, such as duplicate content in meta descriptions. But is that a ranking factor in search engines anyway? I think no.
3. Is your site working well in every browser?
Free Form Exploration using Dimensions: Browser and Browser Version, Metrics: Sessions, Bounce rate, Engagement Rate and Session Conversion Rate
If your website is mostly a set of pages without much fancy programming, it’s unlikely you have any browser compatibility issues. Especially if you’re CMS is up-to-date and doesn’t have a ton of plugins installed.
But why not check? It takes just a few minutes.
For this, we’ll use an Exploration. This will make it easier to see issues because we can build a report with just the dimensions and metrics we need.
- From the Explore menu, select “Free form”
- In the Variables column, click the plus next to DIMENSIONS. Search for and select “Browser” and “Browser Version” then click the blue “Import” button
- In the Variables column, click the plus next to METRICS. Search for and select “Sessions,” “Bounce rate,” “Engagement rate” and “Session conversion rate” then click the blue “Import” button
- In the Settings column, add the two Dimensions as ROWS
- In the Settings column, add the four Metrics and VALUES
- In the Settings column, add a filter where Sessions are > 100
It’s also nice to change the CELL TYPE to Heat map. This makes the potential browser issues pop out a bit more. And it’s a good idea to name it. I called mine “Browser Version Analysis.”
This screenshot shows the setup, but the dimensions and rows wouldn’t fit because the settings column was too tall. But you get the idea. Notice the filter. You’ll need that to remove outliers. Need more data? Choose a longer date range.
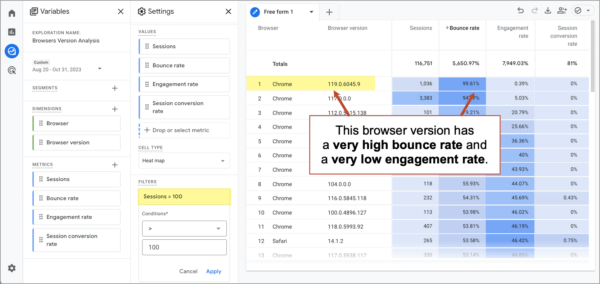 The possible browser compatibility issue is obvious right away. There is a version of Chrome with a very high bounce rate and very low engagement rate.
What’s a good bounce rate? A good engagement rate? Here are benchmarks for you:
Next steps:
- Give the site a thorough browser compatibility test using a device with that browser
- …or use an emulator, such as BrowserStack to quickly test the site from your computer.
While you’re here, check to see what browsers your audience uses. Do your visitors love Safari? No problem. Analytics will show if those folks are enjoying your site.
4. Is your shopping cart broken on certain browsers?
Free Form Exploration using Dimensions: Browser and Browser Version, Metrics: Sessions, Engagement Rate, Session Conversion Rate and Average purchase revenue
If you have an ecommerce website, this same exploration can show you if your shopping cart has browser compatibility issues.
It’s possible that a little bug is causing big ecommerce problems. It happens all the time. A single browser compatibility issue stops users from completing the checkout process and no one notices for months.
But the clues are in your data. Here’s what that looks like in GA4.
You would expect ecommerce conversion rates to be similar across browsers. In this account, between five and seven percent. But one browser, Safari, has a much lower rate, about 1%.
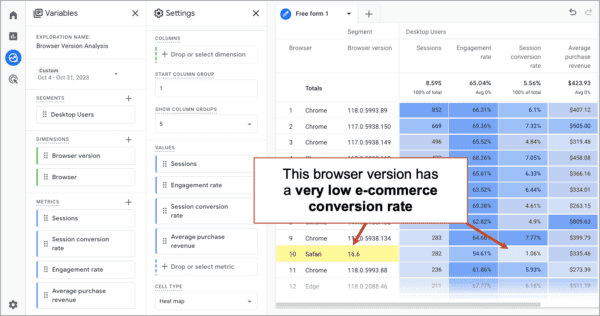 Look at the other columns to get an idea for the hole this punches in sales. If the conversion rate for that browser were in line with the others, considering the average purchase value, the site would generate another $6000 per month. If you see this, your turbo website audit just found a lot of money in under a minute.
Browser issues are less likely for standard implementations of WooCommerce and Shopify. They are more likely for more custom ecommerce with fancy carts.
 |
Jeff Sauer, Founder, datadrivenu.com“If you want to take your cart reports to another level, be sure to implement as many e-commerce events as possible into your tracking. Note that the code is different for GA4 than previously with Universal Analytics, so be sure to read the documentation to see the differences.” |
Next steps:
- Take a deep breath, then send a support ticket to your developer.
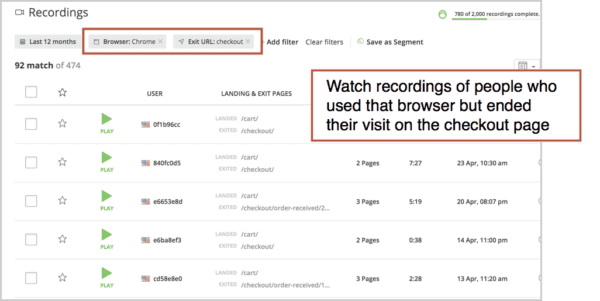
- …or join the struggle. Use HotJar or a similar tool and watch screen recordings of actual visitors. Watch visitors who used that browser but exited the site from the cart or checkout page.You may see some “rage clicking” of frustrated visitors pounding on buttons that don’t work.
 5. Is your site not working on some devices?
Tech > Tech details: “Device model” dimension, filtered so Device category exactly matches mobile
Engagement and conversion metrics naturally vary across devices. Even a very mobile friendly site will have lower engagement rates and lower Average engagement time than a desktop site.
But across all mobile devices, there shouldn’t be a big variance across specific devices, where one type of phone has much lower engagement and conversion metrics. If there are, your turbo GA4 website audit maybe have found a bug.
Here’s how to check:
- Go to the Tech > Tech details report
- Select “Device model” as the primary dimension from the dropdown above the first column
- Create a filter where “Device category” exactly matches “mobile” to exclude all of the desktop visitors
The report will look like this. Look for unusually low Engagement rates and Conversion rates.
![]() You can also create an exploration to highlight the issues more visually. Here I’ve created a scatterplot chart using “Device” as the breakdown. Sessions is the Y Axis and Engagement rate is the X Axis. You can see the exploration setup in this screenshot:
You can also create an exploration to highlight the issues more visually. Here I’ve created a scatterplot chart using “Device” as the breakdown. Sessions is the Y Axis and Engagement rate is the X Axis. You can see the exploration setup in this screenshot:
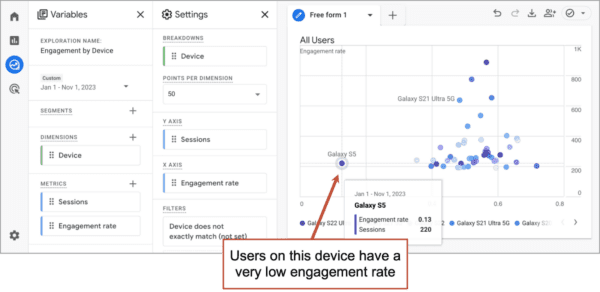
You can immediately see that on this website, Galaxy S5 users are much less engaged than users on other mobile devices! What to do about it?
Next steps:
- Test the site on that device. Again, BrowserStack can help.
- Check the popularity of that device to get a sense for the size of the problem. Take a deep breath.
If everything looks fine, you can go one level deeper into the data. To see if any specific URLs are the issue, check the exit pages for that device. Those users may all be bailing from the same page.
6. Is there a sudden drop in traffic?
Home > Insights > Custom Insights
You may have noticed anomaly detection as an option for explorations. Anomaly detection is also something that can trigger an email alert, letting you know that something is happening.
Could be bad news: the site is down… paid traffic is spiking… you haven’t gotten leads for a week
Could be good news: An article went viral… your ecommerce site is breaking sales records.
You can set up a “custom insight” to send you a message when conditions are met. Here’s how to set up GA4 custom insights:
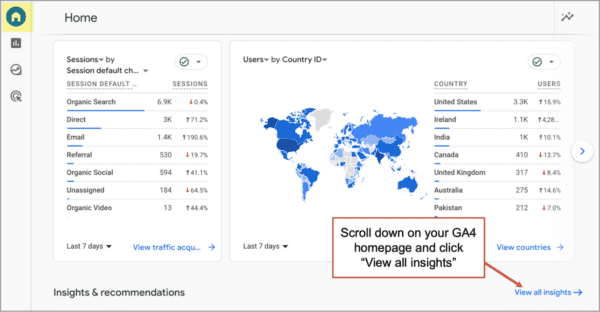
- From the Home screen or Reports snapshot screen, click on “View all insights”
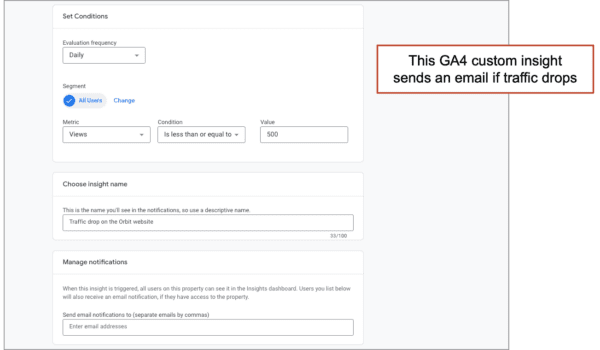
- Click the blue “Create” button in the top right corner
- Set the frequency, metric, condition and value (i.e. daily views drop below 500). Apply this to all traffic or one specific segment.
- Give it a name and enter your email address
- Click the blue “Save” button in the top right corner
- Toggle on Email Notifications
 Once setup Insights appear as cards on your GA4 Homepage and in your Reports snapshot. But probably, you rarely look at these screens.
|
Jeff Sauer, Founder, datadrivenu.com“In addition to receiving alerts when traffic drops, make it a habit to view real-time reports as often as possible during a big campaign launch or after a tracking change to be sure you didn’t miss any steps.” |
7. Are there searches with no search results?
Free Form Exploration using Dimension: Page Path and Query String, Metrics: Event count, Exits
If your website has a search tool, you have a listening tool. You can use GA4 to see what people are searching for. This is useful for content strategy, but it can also show you clues into content gaps …because you can see what people are searching for but not finding.
Suppose you have a toy store. Your site has lots of pages and products, so of course, there is a search tool. When you take a look at your search terms, you can see that visitors are looking for some very specific information: “unicorns.”
But if the visitor searched but then left from the search results page without clicking on anything, they must not have found what they were looking for.
What are your visitors searching for, but not finding?
This question is answerable in your GA4 account. We just need to see which pages with searches (page path + query string) were also exit pages.
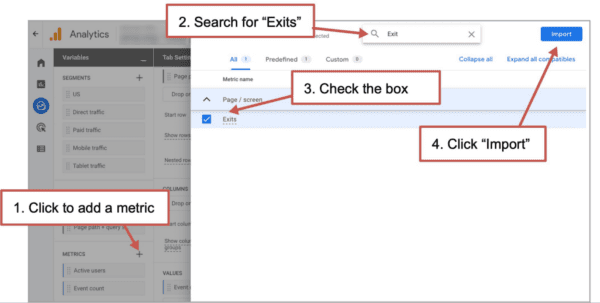
So we need to add the Exits metric to our exploration.
- In the variables column on the left, click the plus next to Metrics.
- A list of metrics will slide in from the right. Search for “Exits”
- Check the box next to Exits
- Click the blue “Import” button in the top right corner.
- Now drag the Exits metric into the “Values” box in Tab Settings.
- Sort by Exits (descending)
Here’s what you’ll see:
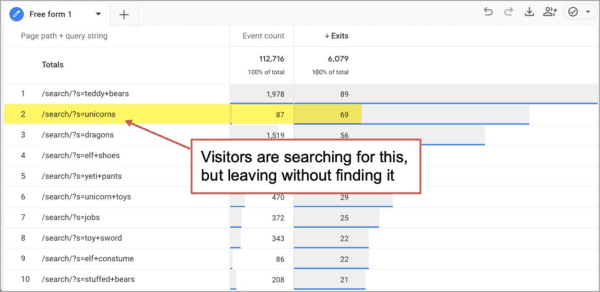 Now you’re looking at a list of what people search for and the last page they visited. You can tell right away that some people are looking for unicorns, but not finding any.
They never clicked. They left without the information they needed. That’s why we call this The Report of Broken Dreams. It shows you what your visitors searched for, but did not find. This is actually one of several ways to do site search analysis using GA4.
Action! This should be an easy fix now that you have search exit data.
- Search for the phrase yourself. What do the search results show?
- If you don’t already have a page on this topic, make one!
- If you do have a page but it’s not ranking, update the page so it ranks higher for that keyword in your site search results. Put the phrase in the title, header and body text.
- Now search again. All better?
Site search SEO is a type of optimization that everyone should love. Make your own content rank in your own search tool on your own website.
Your visitors are telling you something. Use GA4 to listen.
They’re trying to tell you something through your Analytics data. That’s really all Analytics is: information about the behavior of your visitors.
If your website was a physical space, you could sit back and watch them. See if they struggle to move around, to find things and to buy.
But since our visitors aren’t here, we can’t watch them physically. We use javascript tracking code and cookies instead. The clues are right there in your GA4 data.
The good news? Those clues are just a few clicks away.