What’s the clickthrough rate of your CTA? How are your menus performing? What do mobile visitors click?
Think of it this way. If your website was a city, there would be roads running through it.
These roads are the “user flows” that visitors follow through your navigation, internal links and CTAs. Some are very popular, just like highways. Some are not popular at all, just like backstreets.
What is a user flow?
A user flow is just the series of pages that define a website visit. It includes all the steps that a user takes as they click around. They’re really for any digital experience, including apps, but here we’re focused on websites.
Today we’ll use GA4 to find where visitors are flowing so you can see the difference side-by-side.
We’re answering big questions that every website owner should know:
- What is the top path through my website?
- What are the clickthrough rates (CTR) of my call to action (CTA)?
- How effective are my drop down menus?
- Are the flows of mobile and desktop visitors different?
- What percentage of contact page visitors complete the form?
Let’s jump into the questions and analysis. If you’d like to capture your findings, we’ve put together a handy little User Flow Analysis Worksheet, which you can use as a template for benchmarking:
Steal this User Flow Analytics Worksheet
What is the top path through my website?
We’ll do it using a GA4 Path Exploration. Here’s the process.
- Go to Explorations and select “Path Explorations.”
- Click “Start over” in the top right.
By default, it will show an exploration with the “session_start” event as the starting point, which isn’t what we need here, so we need to start fresh. - Pick a date range that gives you lots of data using the date range selector in the top left,. That means a bigger range if you have a low traffic website. Avoid time periods with seasonal weirdness or big website changes.
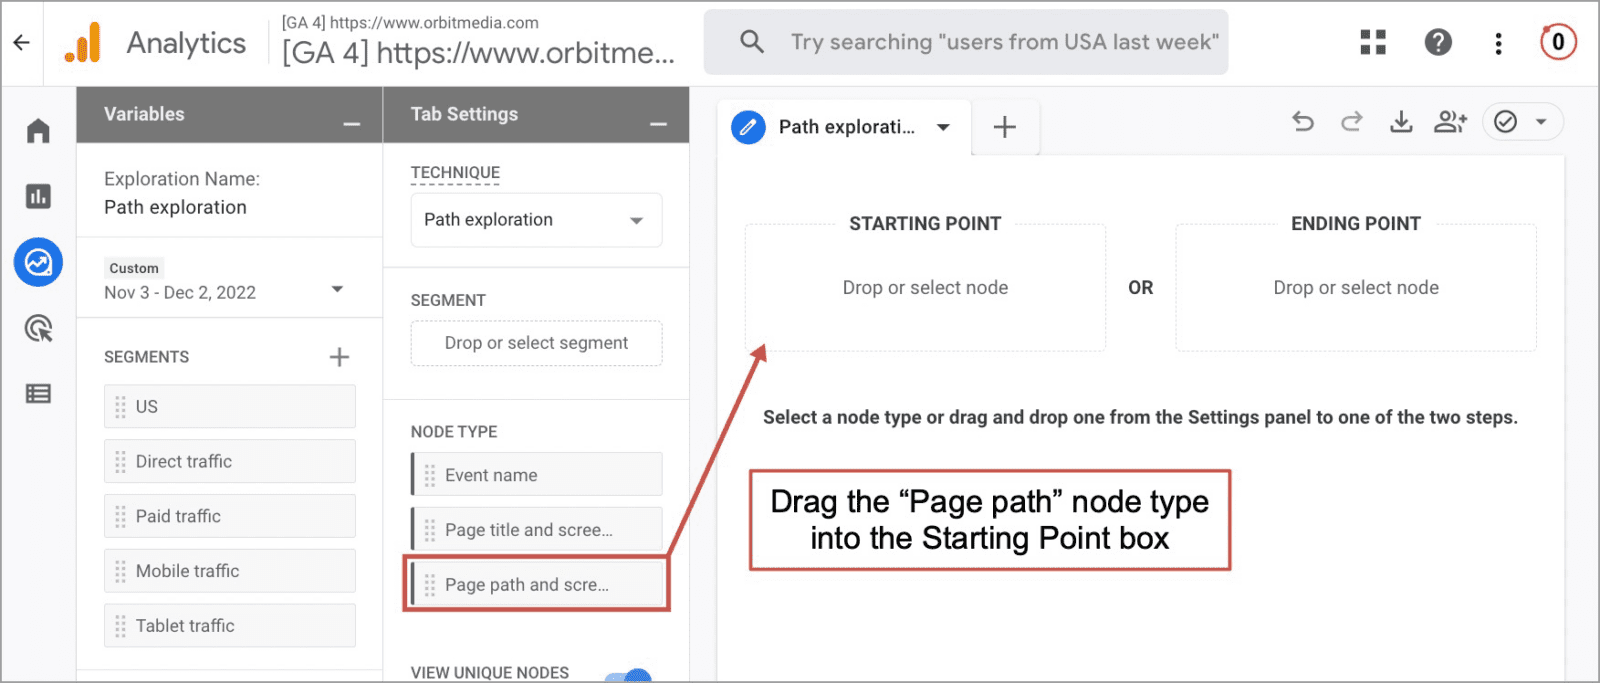
- Drag the “Page path and screen class” node type into the Starting Point box.
We want to analyze the flow through a specific page. This will let us select the page. (“Page path” in GA4 is like the “Page” (or URL) in Universal Analytics)
- You’ll see a list of pages slide in from the right. Click on the page you’d like to explore, such as the homepage.
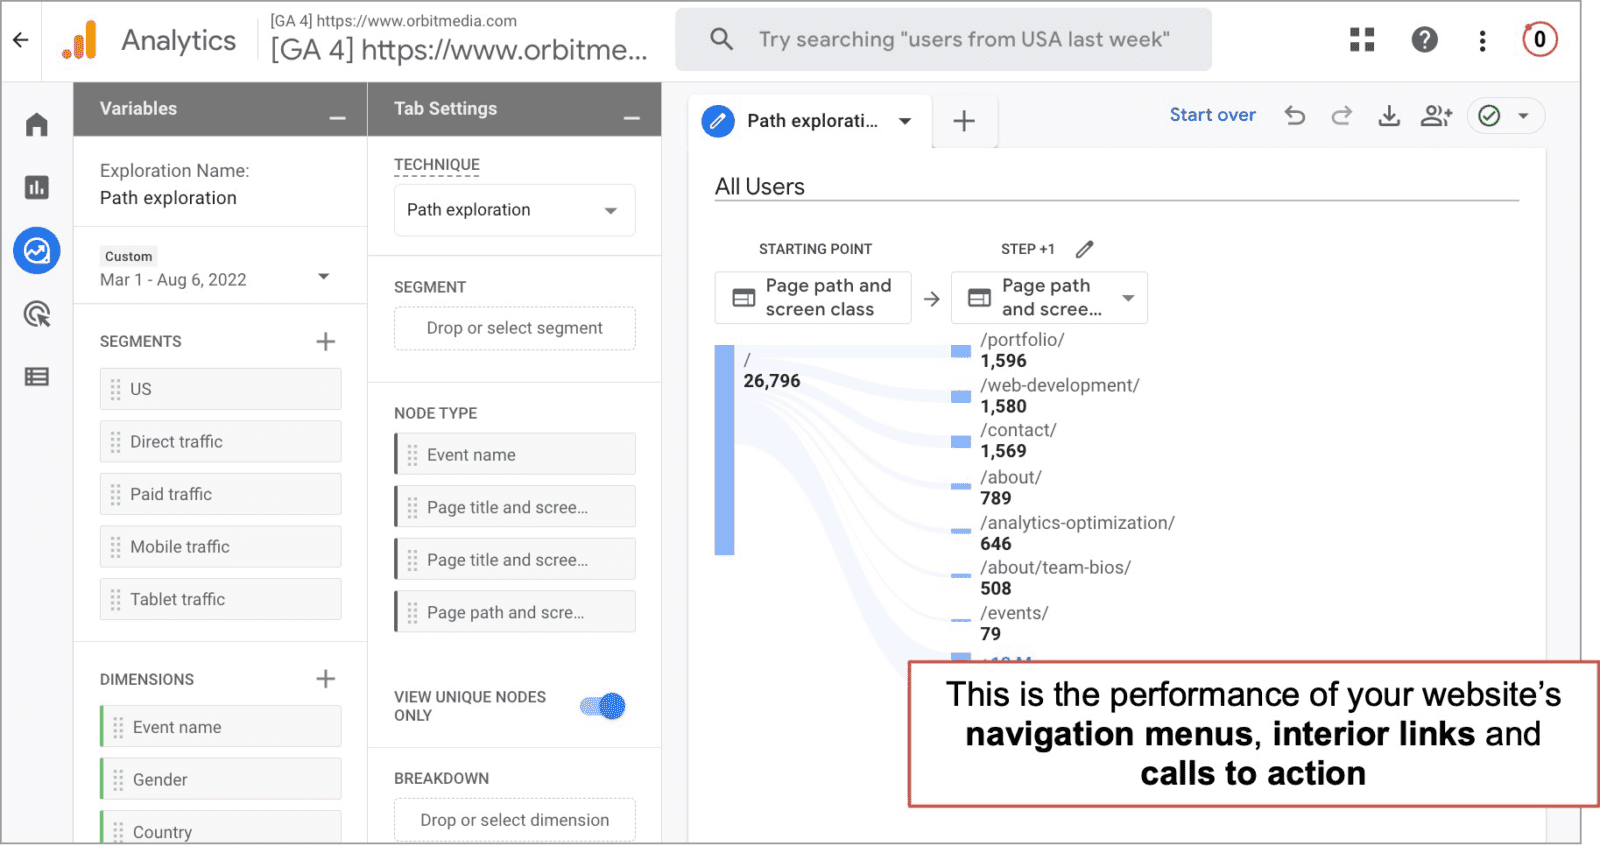
- Now you’re looking at the flow of traffic from your homepage to deeper interior pages. This is the performance of your website navigation. It should look something like this:
- If you see things here you’re not interested in (for example, if you focused on lead gen and want to remove people who go to the blog or the careers page) you can click on the little pencil next to “Step +1” and uncheck the boxes for those pages.
What to do next…
Now that you can clearly see the flow, you have the perfect opportunity to optimize your website navigation.
- If little things get clicked a lot…
Consider making those options more visually prominent. And look at the content behind that click and ask yourself if it shouldn’t appear earlier in the visitors’ experience. - If big things get missed…
Consider removing them. If they’re not something you’re actively promoting, and if they don’t align with an actual business outcome, they may just be adding visual noise. - Put billboards on highways…
Take a minute to personally click through your top path. What did you see? What did you miss completely? Consider moving content around so that your best assets/content are also your most visible assets/content.
What are the clickthrough rates (CTR) of my call to action (CTA)?
With those same reports, we can see what percentage of visitors are clicking on our calls to action. Marketers should know the CTRs of their CTAs. It’s an absolutely critical metric for anyone hoping to generate demand for anything.
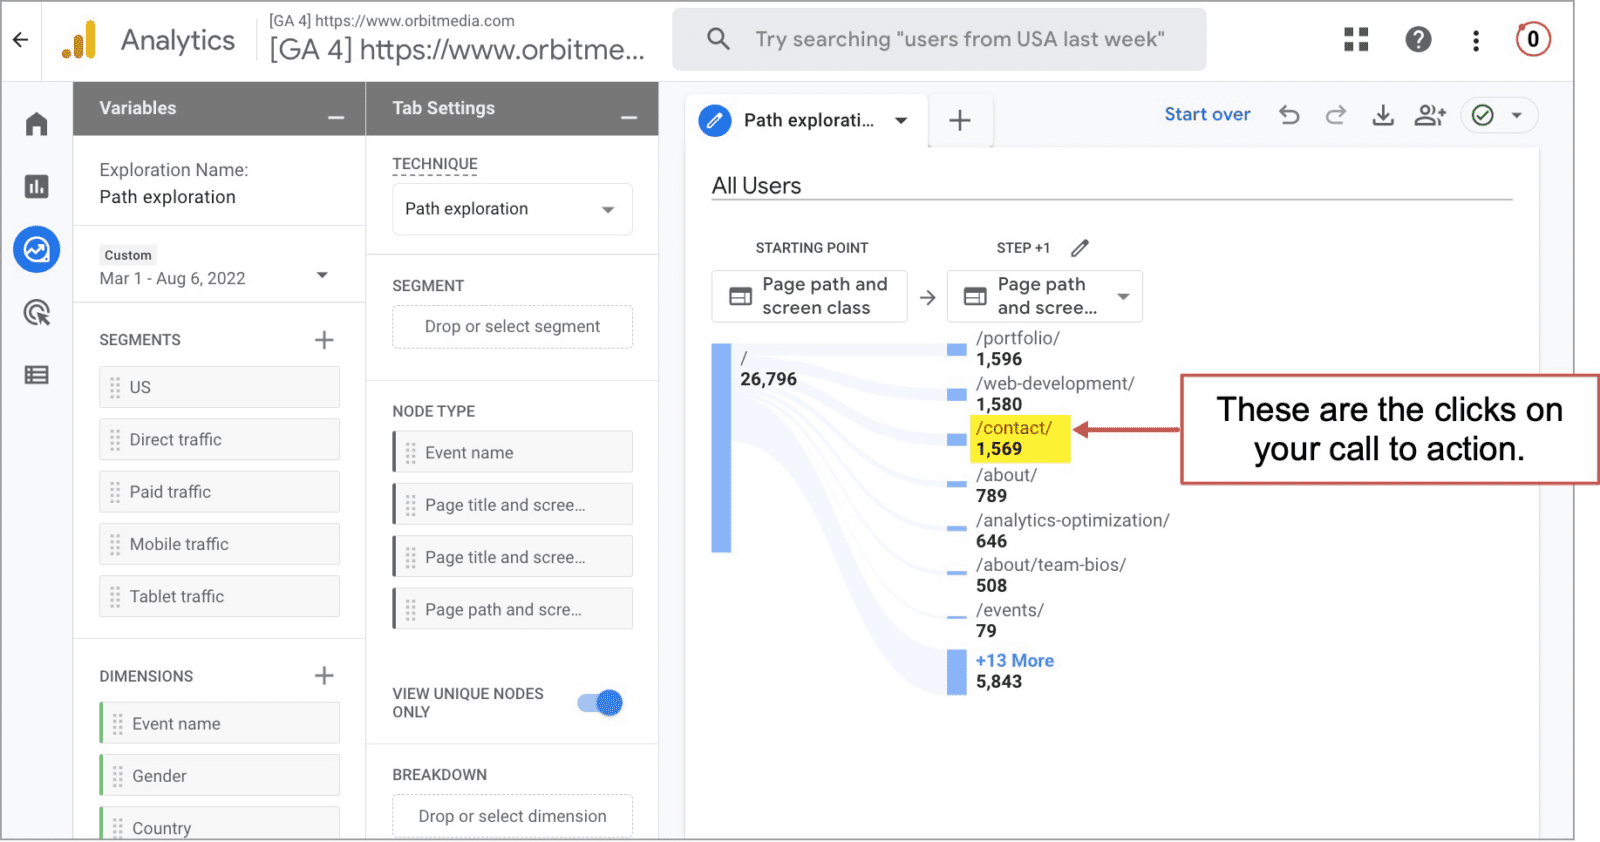
We’ll use the same GA4 Path Exploration. Notice the traffic from the homepage to your contact form? Those visitors clicked on that call to action.
To get the conversion rate…
Use a solar powered calculator to divide the number of sessions in Step +1 from the number of sessions on the Starting Point. You may need to work with this data a bit more for better accuracy and insights.
If there are multiple ways to get to that page…
For example, your CTA is in both your header and your featured area, then the exploration isn’t really just measuring the one CTA. It’s showing traffic to that page regardless of which of the two options they clicked.
To see which of the two they clicked, you’ll need to use another method if you want to see which option they clicked, such as a heat mapping tool, enhanced event measurement or by adding referrer tags on the CTAs, such as ref=”header” (last resort).
If your calls to action take people to another website to convert…
Those clicks won’t appear here. It’s common. Applicants go to the job website to apply. Donors go to the donation platform to donate. If you have “offsite conversions” you’ll need to set up cross domain tracking.
If clicking your CTA doesn’t take the visitor to another page…
For example, if clicking the CTA brings up a form in a popup window (not a separate URL), and if it shows the visitor a little thank you message if they complete it (also not a separate URL), then you need to do some fancy event tracking to measure success.
And because these non pageview UX features have no benefits to you or your visitor, ask yourself why you’re doing it that way. It’s weird. You probably need a better website. Measurement (and UX) are generally better with a flow of pages, not popups.
What to do if your CTA has a low clickthrough rate…
Disappointed with a low number? Need to stir up more demand? Baby need new shoes?
Maybe you’re just never satisfied. Or maybe you just love the sport of digital marketing. Whatever the case, here’s a quick list of five fun and effective ways to increase the percentage of your visitors who click on your call to action.
- Answer more of your visitors’ questions. The greater the clarity, the greater the conversion rate.
Here’s a quick tip from a UX/CX pro and good friend:
 |
Jeannie Walters, Experience Investigators“Provide more value by taking note of the questions your prospects and customers have outside of the digital channels, too. For example, keep a log of what questions come up after presentations or during business development calls. Those tell you where to direct content around answers they’re seeking.” |
- Add evidence, such as trust seals (awards, certifications, memberships, logos), social proof (testimonials, reviews) or data (years in business, ROI, number of happy clients). For service firms, supportive evidence is often the only differentiation on the page.
- Add personality. Putting a face near the call to action adds a bit of humanity at the key moment.
- Strengthen the verbs in the CTA. Make it longer and more specific. Change “Get in touch” to “Schedule a quick call with Dave.” Change “Book Now” to “Reserve your spot in paradise”
- Confirm that the traffic sources and visitor intent align with the offer. Motivation is the biggest factor in conversions and changing the actual motivations of your visitors is basically impossible.
How effective are my drop down menus?
Drop downs help visitors quickly get to deeper interior pages, shortening user flows. That’s good.
But drop down menus also help visitors skip top level pages, which may have compelling content and assets that don’t appear on those deeper pages. That’s bad.
Are your visitors jumping right over that great video testimonial? That great case study? Your best sales message? Let’s do the analysis.
Check back on that same GA4 Path Exploration with “Page Path” as the node type and the homepage (or any of your top landing pages) as the Starting Point.
It will look like this:
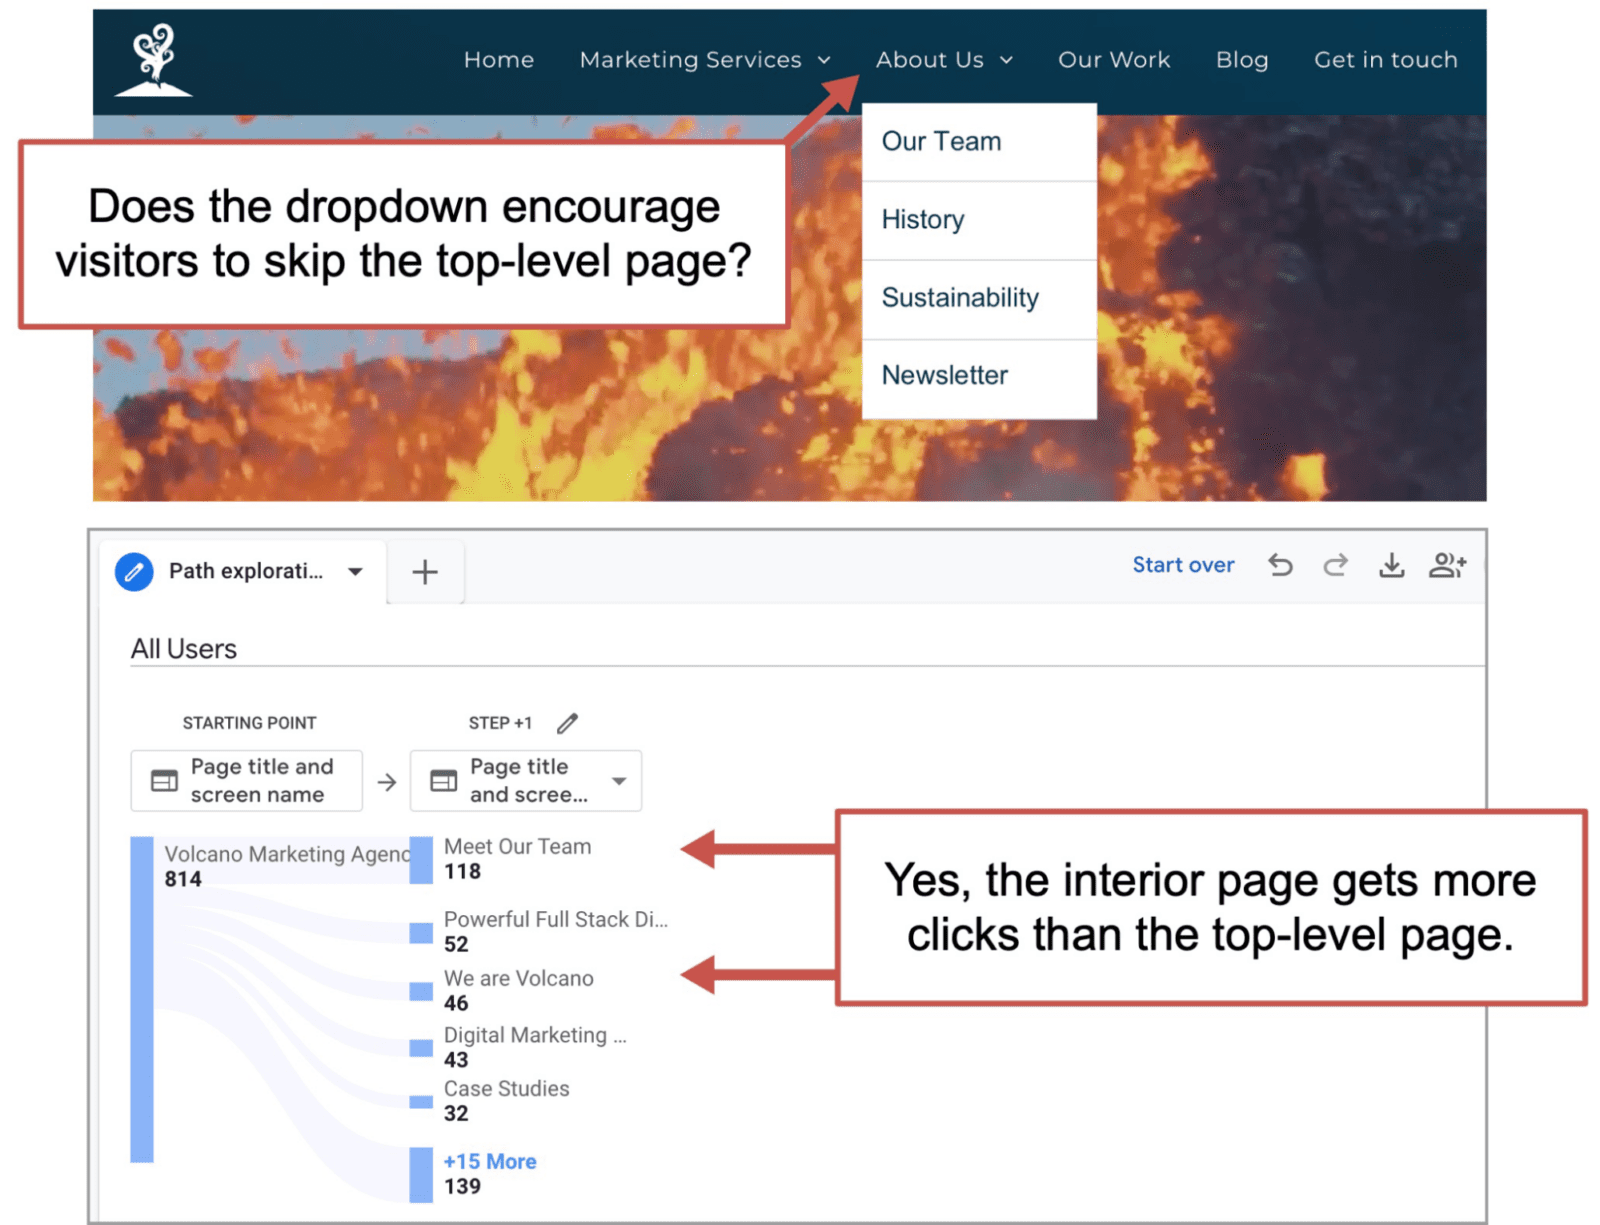
What to do if visitors are jumping over a top level page…
It’s not necessarily an issue. It just means that one of your pages isn’t as popular as you might have thought.
Look closely at that page. Is there any content there that should be moved into more prominent locations? Any videos, diagrams or other assets? Any answers, messaging or other copy? Add them to other places or they’ll keep getting skipped.
Example: If they’re jumping over the About Us page and it has a great video. Move that video to the homepage.
Look closely at the content they’re jumping too. What does it tell you about your visitors’ information needs and desires? Can you help them find that even faster?
Example: If they’re jumping to the team page, add a team member block to your homepage (your testimonial block might do the trick) putting faces and mini-bios of your team earlier in the flow.
Do mobile and desktop visitors have different user flows?
The mobile and desktop visitors have very different user experiences. Desktop visitors can glance at navigation labels to confirm that they’re in the right place. Top level menu items jump off the page.
But mobile UX? These visitors need to tap a hamburger icon to even see the menu. This is a mobile UX design best practice. It’s standard to hide the labels. And because they have no mouse cursor, they often need to tap again and scroll to see the full menu.
How are the user flows for your mobile and desktop visitors different?
Let’s do the analysis:
We’ll use GA4 Path Exploration with segments added. Just like before, go to Explore > Path Explorations, click “Start over” in the top right, and drag the “Page Title and Screen Class” node into the Starting Point box. From the options that appear, select the home page, or whichever page you’d like to analyze.
This time, we’ll add a segment. In the Variables frame (the first column on the left), click the plus next to Segments. You’ll be given options for several types of segments. Here we’ll be creating a User Segment.
Click “Add new condition” and select “Device category.” It’s a dimension in the “Platform / Device” group, but it’s easy to just search for it. There are useful little search boxes everywhere in GA4. Next, click “+ Add filter” where the condition is “contains desktop.” Give it a name such as “Desktop Traffic” and your screen should look something like this:
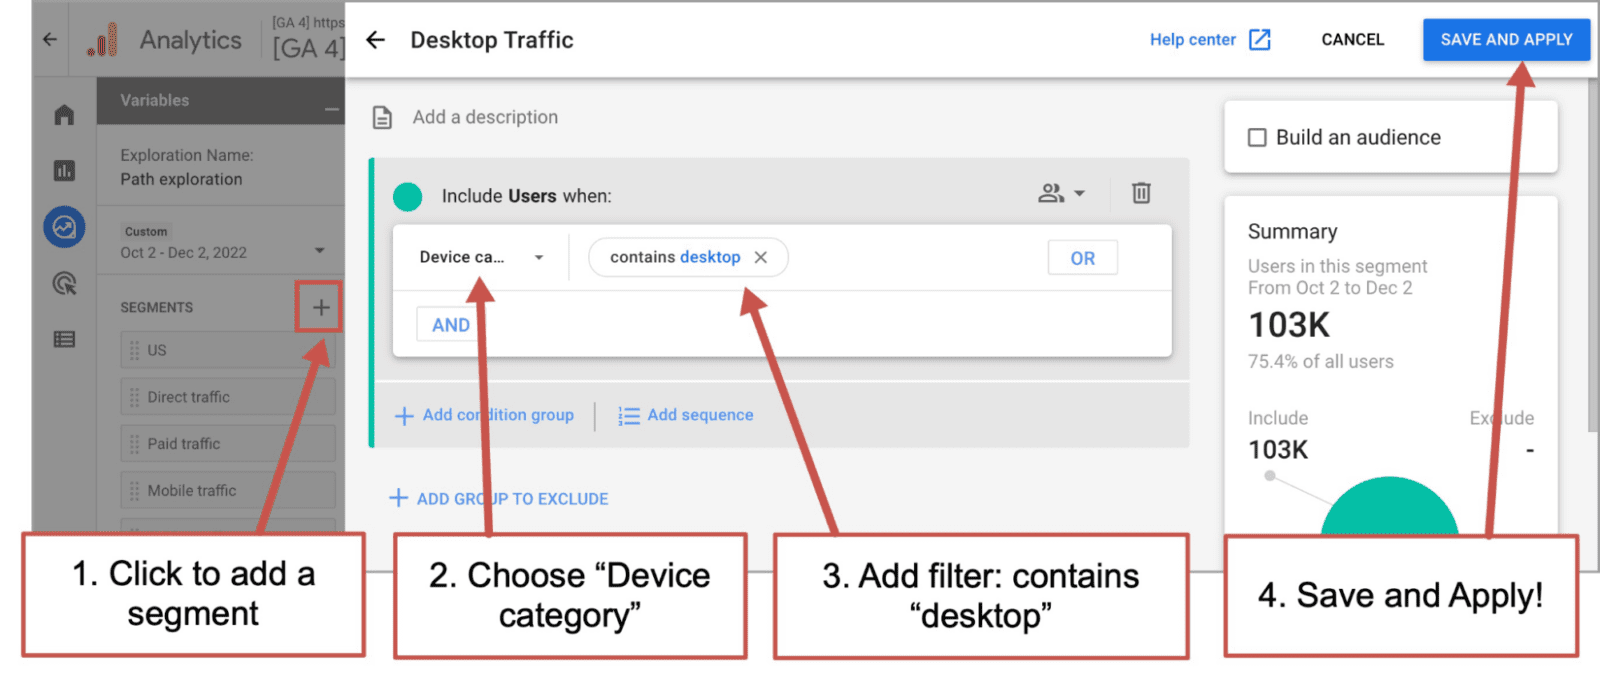
Once you click “SAVE AND APPLY” you’ll be looking at the flow for just your desktop visitors.
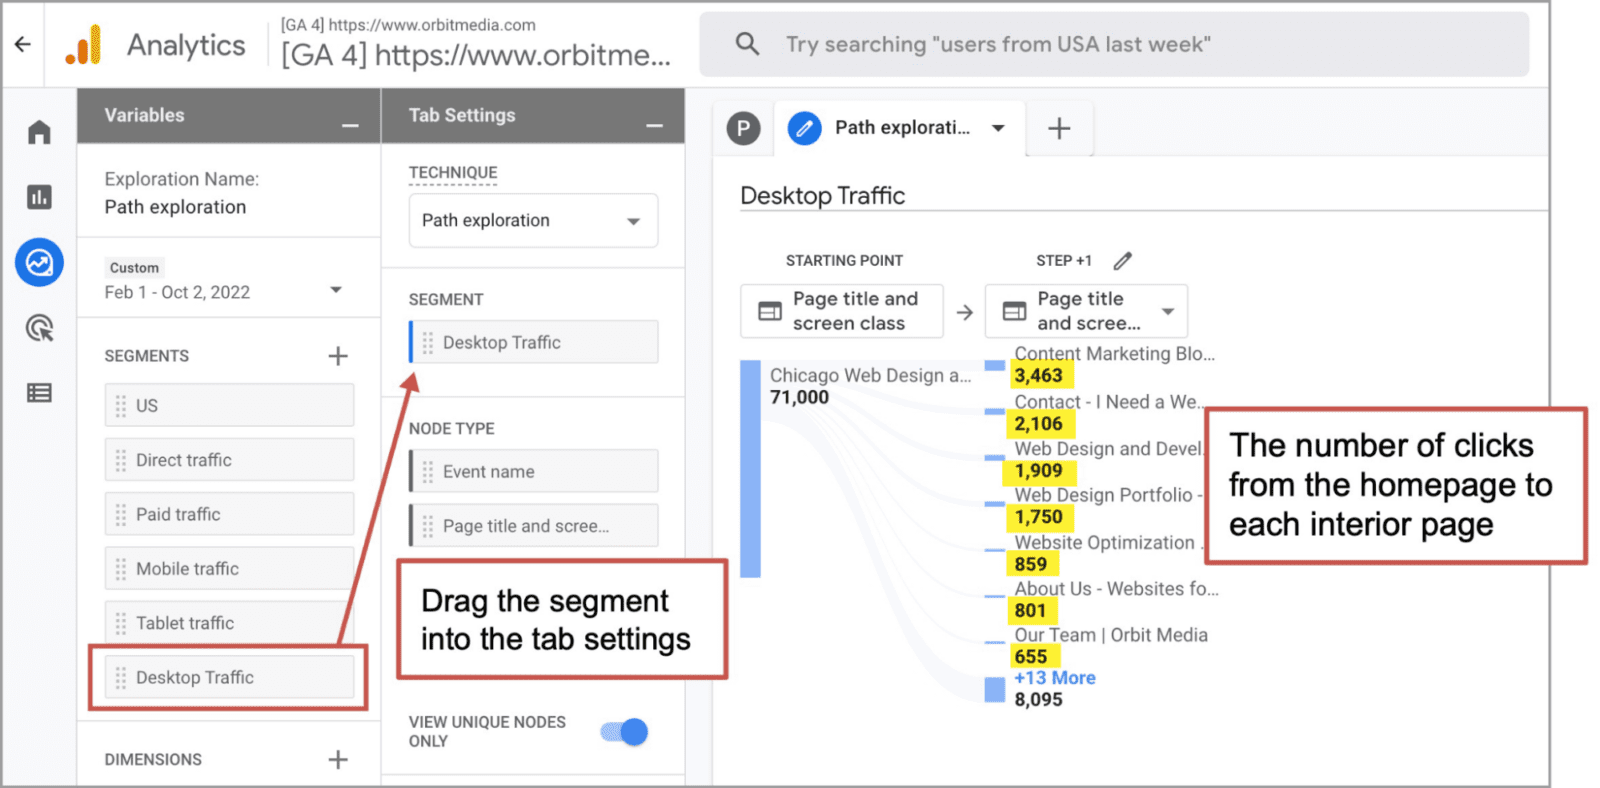
Again, to get the conversion rate, divide the number of sessions in Step +1 from the number of sessions on the Starting Point.
You’ll also need to create a separate Path exploration (on separate tabs) to see the difference between mobile and desktop. There are no comparisons or multiple segments in GA4 explorations, so you’ll need to compare two separate user journeys on two separate tabs.
What percentage of Contact page visitors complete the form?
Not everyone who visits your Contact Us page will complete the form. That’s natural. The visitor might just be wondering where you’re located. It’s a page that satisfies multiple visitor intents.
But if you can increase the percentage of visitors who complete the form, you’ve strengthened the final link in the lead generation chain. You’ve plugged leaks in your bucket. You’re getting more juice for every squeeze …Pick your favorite metaphor!
Here’s the process for optimization:
- Benchmark your current Contact page conversion rate (methods below)
- Make some improvements. Run with your best hypothesis (weird ideas welcomed)
- Wait until a few thousand visitors go to the page (duration depends on traffic volume)
- Check the conversion rate again (same methods below)
If one in every four rounds of this process leads to a positive result, you’re doing great. The final step: add “Conversion Optimization” to your LinkedIn profile.
We’ll use the same GA4 Path Exploration, but this time, we’ll use the Contact Us page as the starting point.
If you have a path exploration already set up, click start over in the top right, drag the “Page path” node type into the “Starting Point” box and then select the contact page from the frame that slides in from the right. If you don’t see the contact page, you may need to search for it.
You should see your thank you page in the Step +1 column. Click on it to see the flow from there.
The report should look like this:
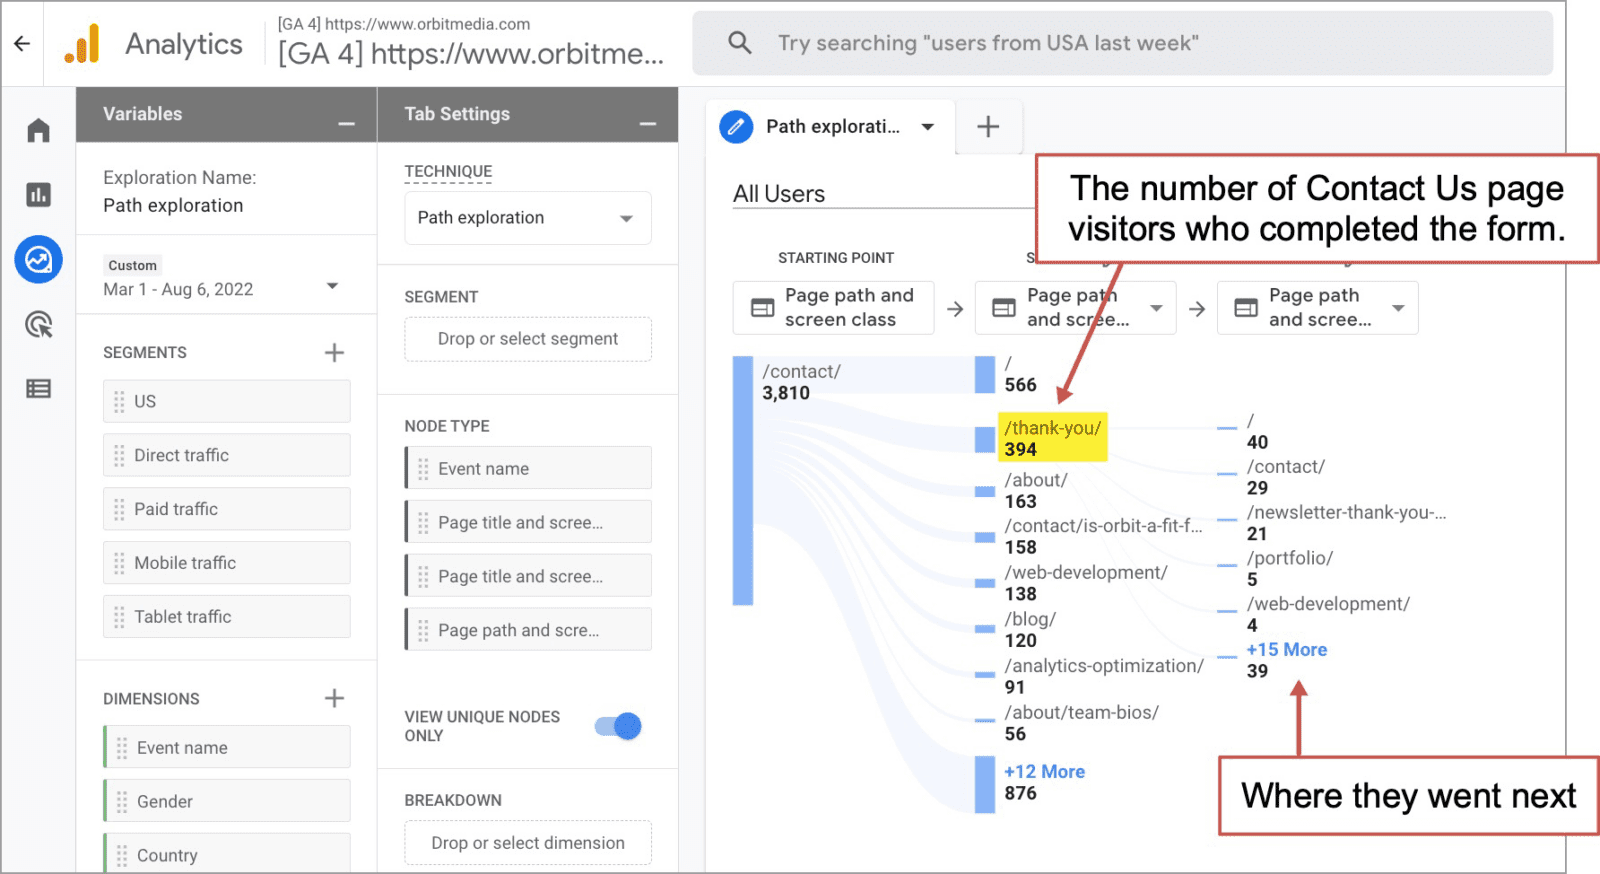
Again, GA4 doesn’t calculate conversion rates, so you’ll need to divide the thank you page visits from the contact page visits separately. Use an abacus or Microsoft Power BI, whichever you prefer. In the above example, the conversion rate is just over 10%.
What to do about your Contact Page conversion rates…
- For higher conversion rates…
Add elements that may increase trust (certifications, awards, other evidence) or set expectations (face of the person who will respond, typical response times) or reduce friction (make the form short, easier). - For more accurate analytics…
And if your contact page is for two types of visitors (for example, a form for prospects and a support button for clients), consider making two separate pages with separate forms for those separate audiences. - For better content marketing results (email and social media)…
Add an email signup CTA or social media icons to the thank you page. These can grow your list and social followings, while discouraging your new prospect from looking for other options.
Note: In the screenshot above, you can see traffic from the thank you page to a subsequent “newsletter thank you” page. Those are visitors who subscribed to the email list using a signup form on the contact form thank you page. The conversion rate of that CTA is 5.3% (24 divided by 394). Free subs!
|
Jeannie Walters, Experience Investigators“Conversion is all about your needs as the business. Marry that with the overall customer journey to really deliver what users want when they want it. Analytics like these are a great tool to reflect on if the content is really about and for your audience or not. Their actions show their interest.” |
It’s Analytics, so expect the unexpected
A lot of unexpected insights pop up when you first start looking at visitor behavior data. But website user flows and clickthrough rates are especially likely to surprise you.
These are all things I’ve seen doing user flow analysis over the years.
- The #1 click on a big homepage with mega menus …was a small link in the footer
(spoiler: it was “our team”) - A link with a 99% clickthrough rate
(spoiler: it said “I am 21 or over”) - A “schedule a consultation” CTA drove a 33% clickthrough rate on one site and 0.5% on another
(spoiler: one was an urgent care website, the other was for legal services)
The better you understand the user experience, the more likely you guide that traffic toward success. That means knowing where the roads flow, removing dead ends and putting your best billboards on your busiest highways.
Bonus: If you’d like to record this analysis, not in a user flow map, diagram or flow chart, but on a simple template, we’ve put together a handy little User Flow Report Template:
Steal this User Flow Analytics Worksheet
More User Flow examples:
Here are samples of top paths for several types of marketing sites, both good and bad.
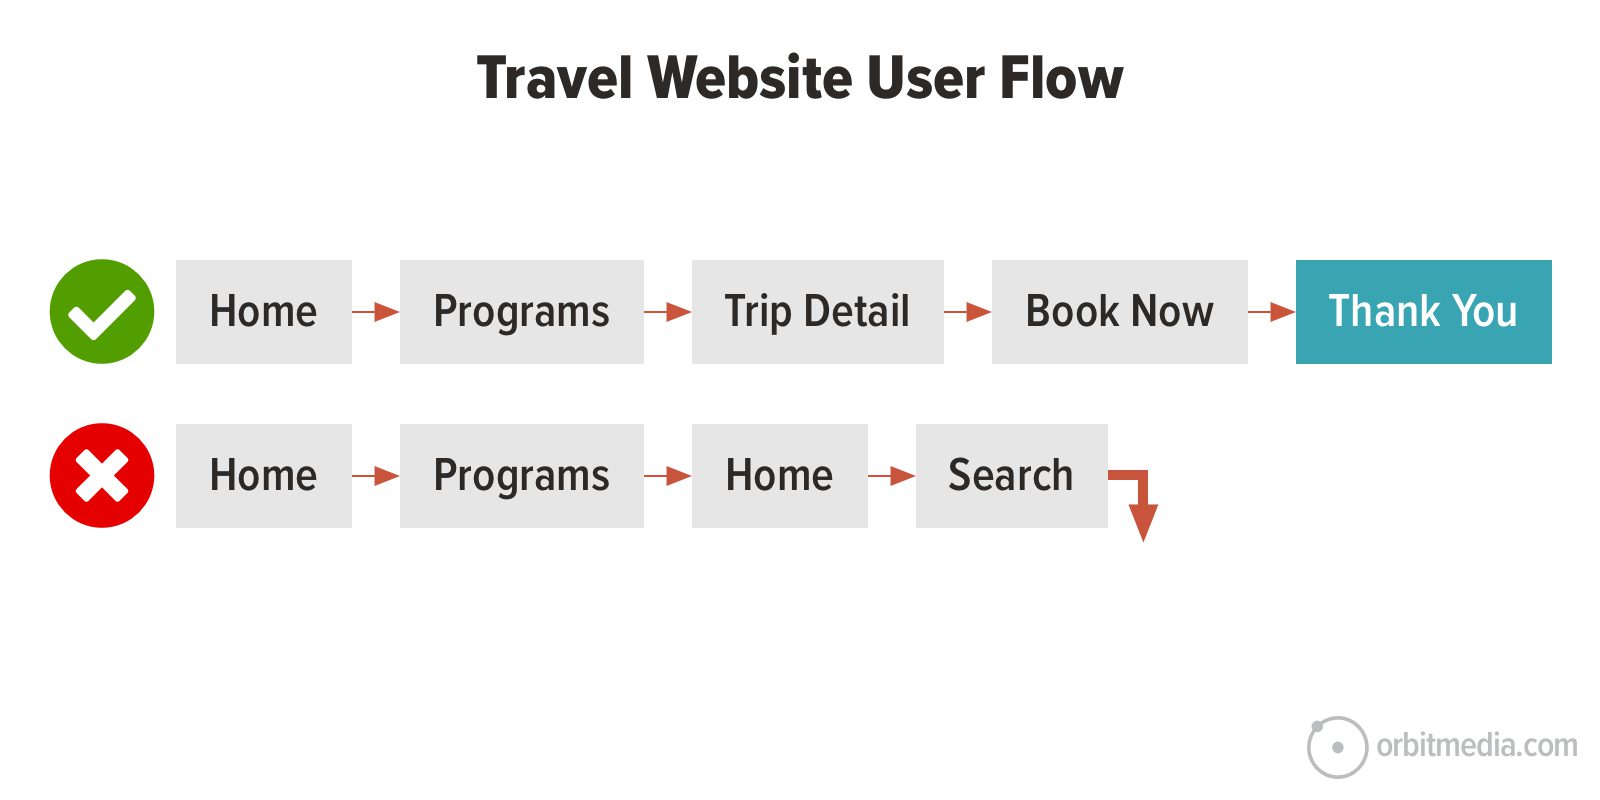
Travel website
Homepage > travel programs page > trip detail page > book now > thank you
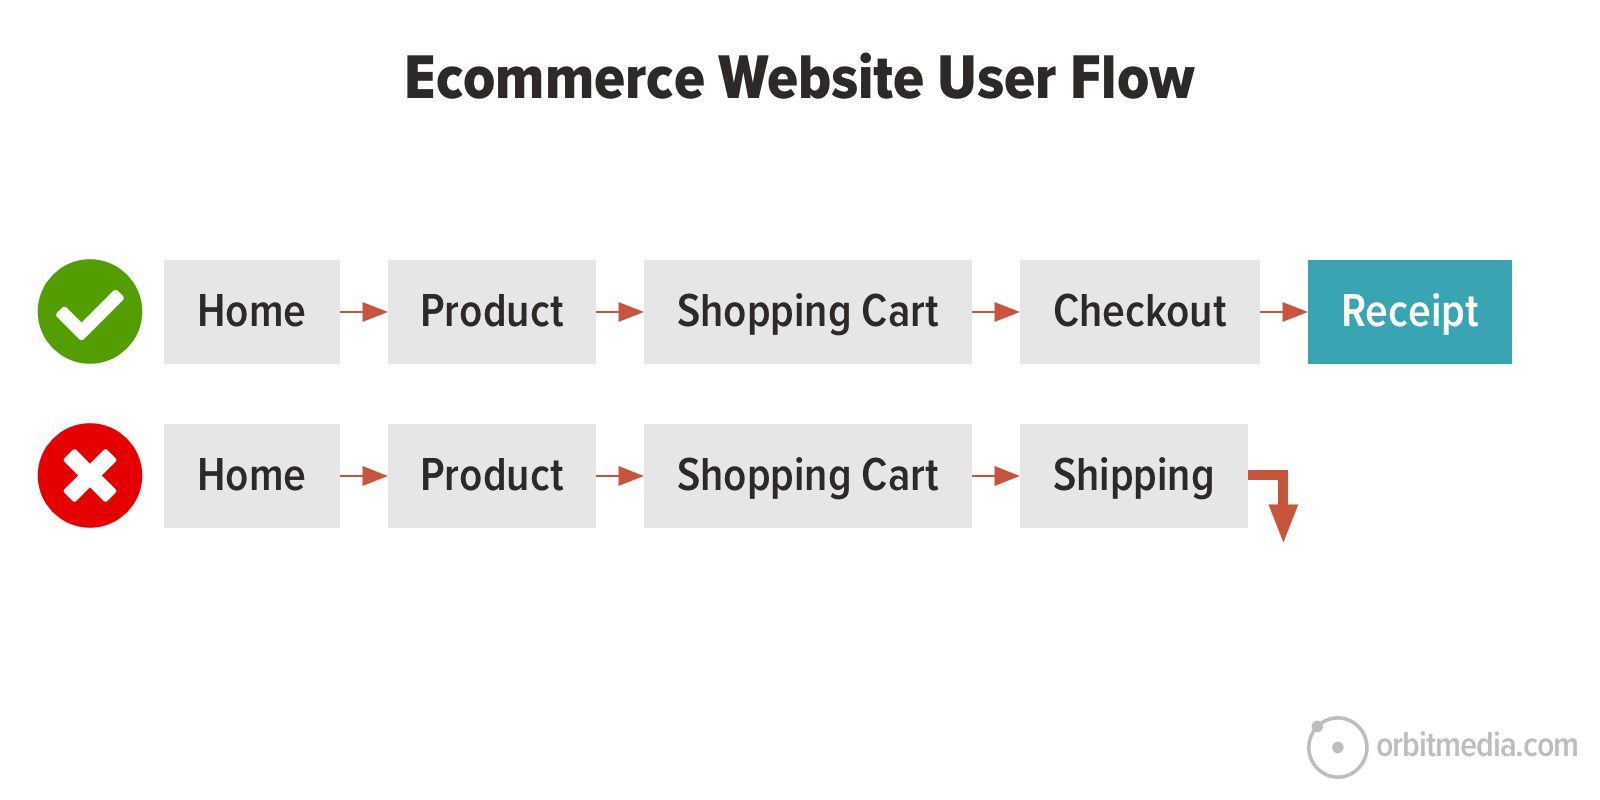
Ecommerce website
Homepage > product detail page > shopping cart > checkout > receipt
Lead generation website
Homepage > service page > about page > contact page > thank you
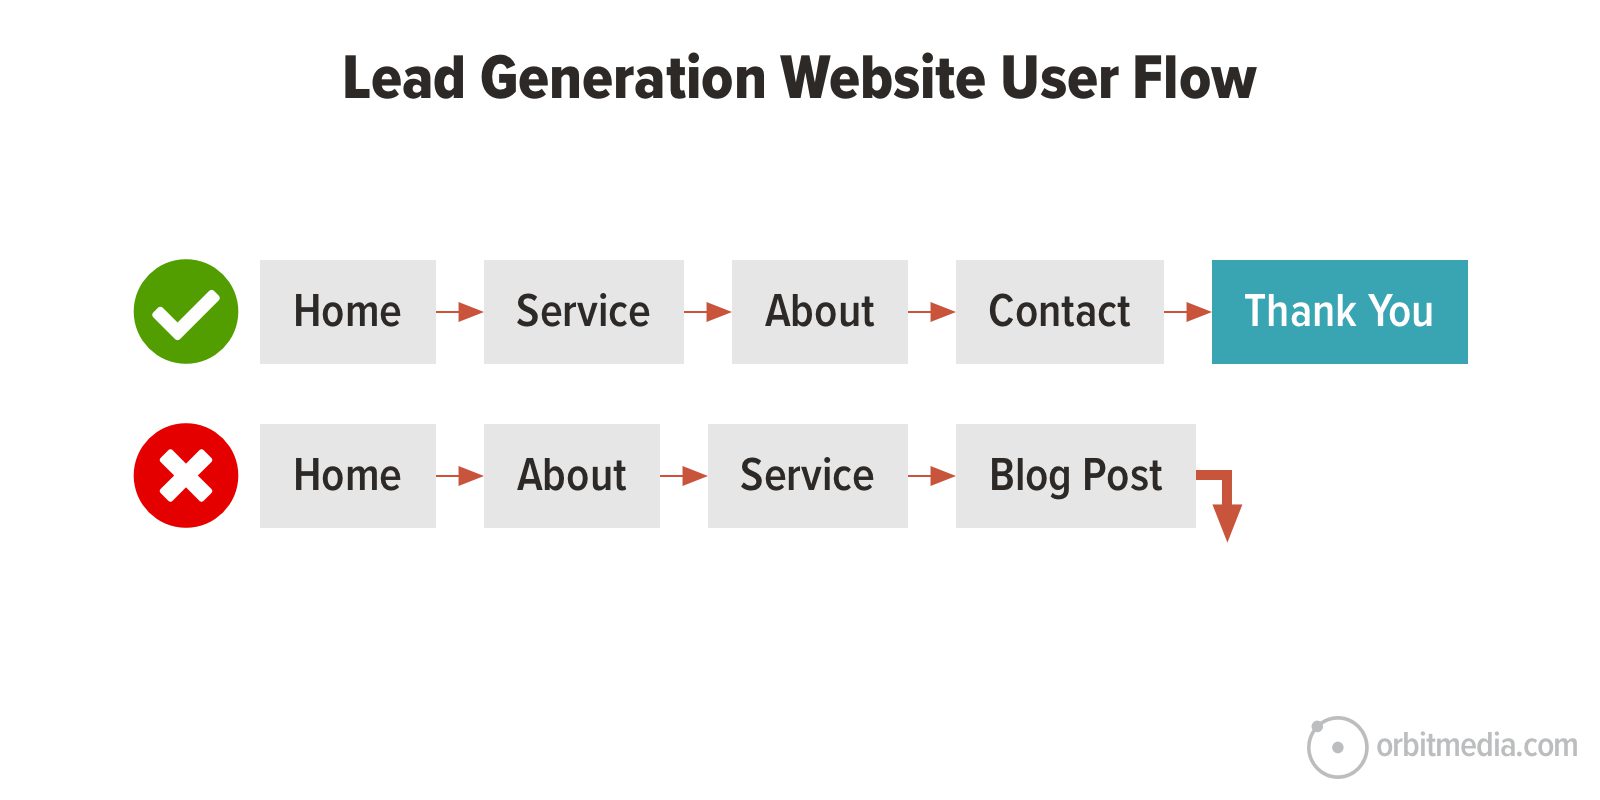
ProTip: To optimize the top path through a lead gen site, follow these best practices.
It’s the most important question that marketers never ask…
If you haven’t asked your Analytics about your user flow lately, you should. User flow analysis is the key to getting more value from your current traffic.
Think of it this way:
The goal of web design is to guide visitors through a series of pages during which…
- Their top questions are answered and objections addressed
- They find evidence that supports your marketing claims
- They finally take action, asking for your help
Are your navigation and content working together to make this happen?
Visitors are flowing through your site right now, as you read this. So rather than leave a comment, go find your user flow and direct some traffic!