It’s easy to see what content drives traffic.
It’s one of the most popular reports in Analytics. The Page path report is sorted by sessions so it’s all right there. Most marketers know their most visited articles.
It’s hard to see what content drives conversions.
There isn’t a report in GA4 that shows the conversion rates of your articles. That’s why very few marketers know their top converting articles. But those top few articles are far more compelling than the rest. The conversion rates of the top 10 are probably 10x the average. According to your audience, these are your very best. They grow your list.
But which ones are they?
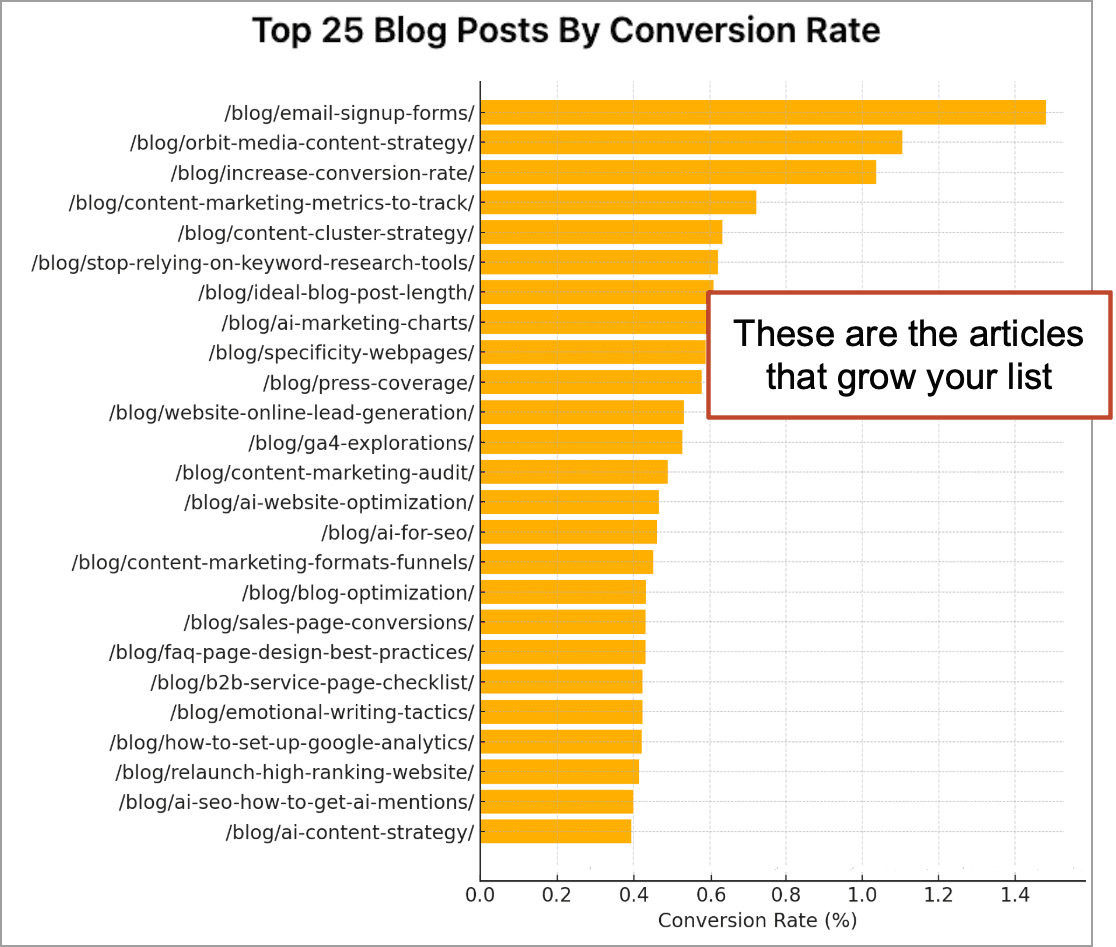
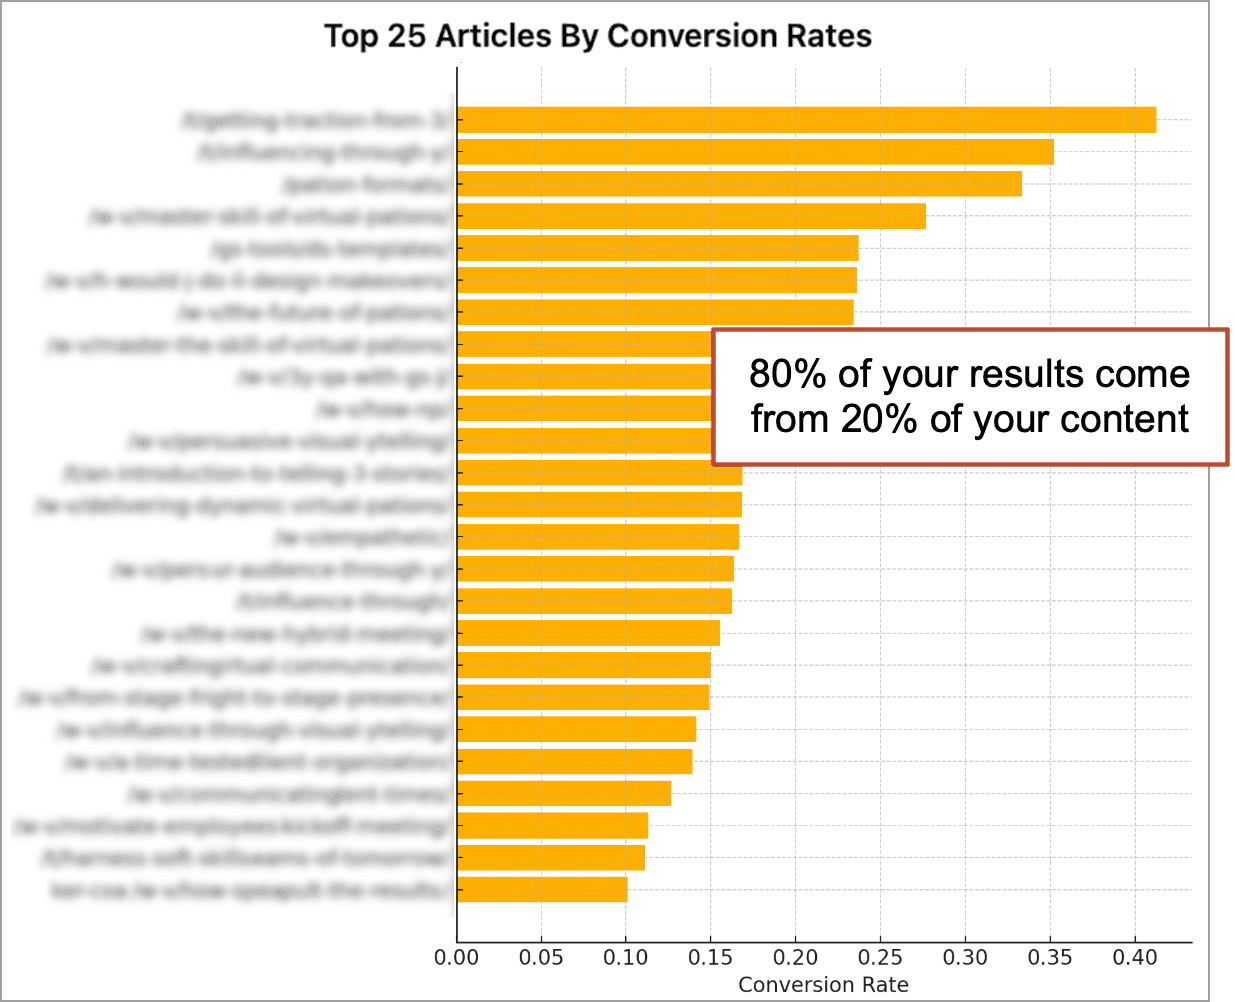
Imagine a chart that showed the conversion rate for all of your articles. It would look like this…
Here are the step-by-step instructions for creating that chart for your content using GA4 and AI. To find these conversion champs, we’ll need two pieces of data:
- The traffic to each article (sessions)
- The conversions from each article (sessions to the thank you page when each article was the referrer)
With the traffic and conversions, we’ll have all we need to calculate the conversion rates. Just upload both reports to ChatGPT, ask it to merge them, do the math, then draw that lovely bar chart.
Note: The method is described for a website where all articles are in a folder called /blog/. Articles have a sticky footer signup CTA, so users flow directly from articles to the thank you page. If the location of your content or the conversion flow for your subscribers is different, you’ll need to adapt this method. Ask your web partner.
Step 1: Export the traffic report
We need to use a GA4 exploration, because Google doesn’t make all data available in all reports. We need “Page referrer” which currently isn’t an available dimension in the reports, unless you add it as a custom dimension (recommended). Anyway, GA4 explorations are an important skill for any digital marketer.
First, here’s the screenshot showing all of the settings and the final report:
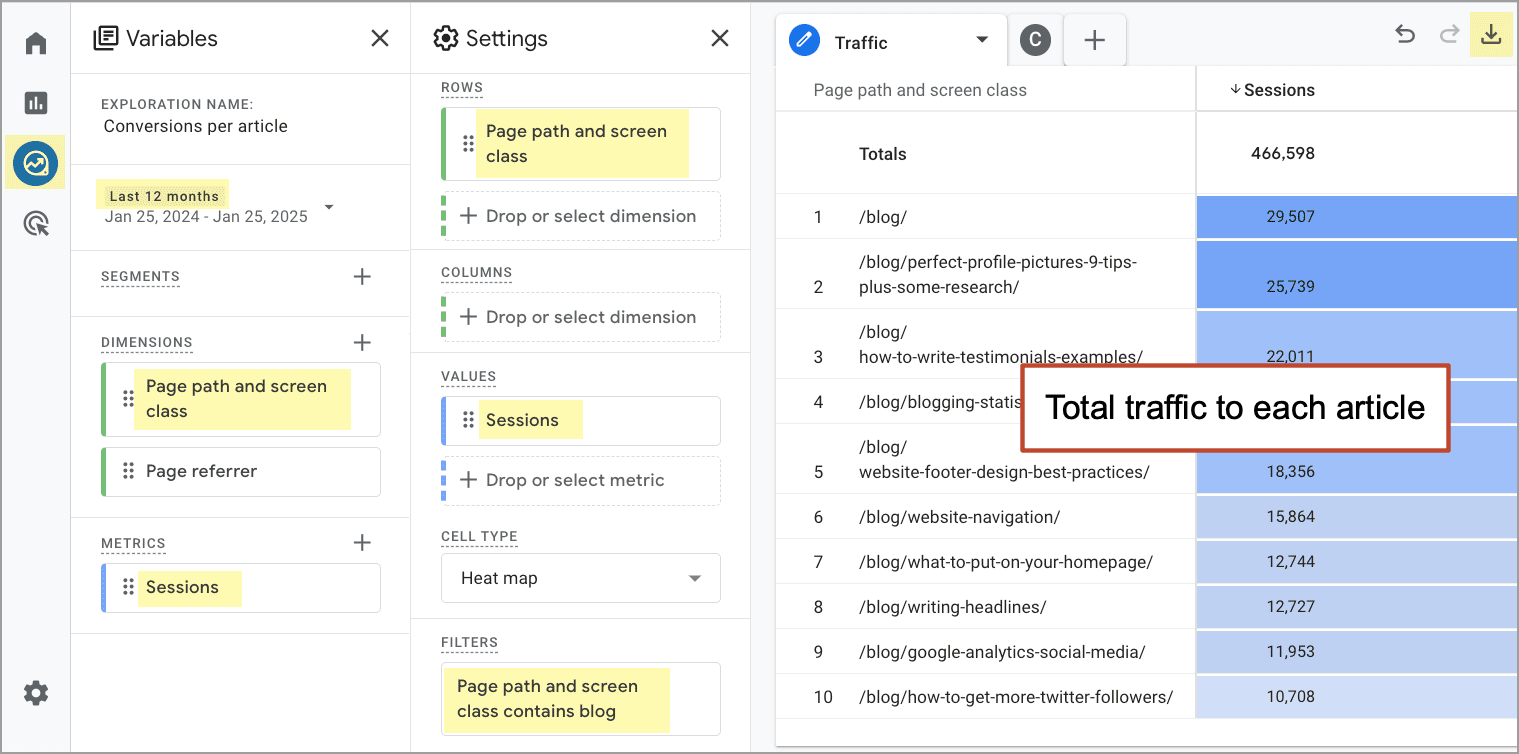
Here’s the step-by-step instructions.
- Go to the Explorations section by clicking the little crooked arrow button in the far left of Google Analytics
- Click on “Blank” to create a new exploration and name it “Blog Performance” or something similar
- Set a long date range such as “Last 12 months” (Hopefully, by now you’ve changed your “Data retention” settings from 2 months to 14 months!)
- Click the + next to DIMENSIONS, then search for and select “Page path and screen class”
- Click the + next to METRICS, then search for and select “Sessions”
- In the settings column, click the + under ROWS and select “Page path and screen class”
- Click the + under VALUES and select “Sessions”
- Click the + under FILTERS. Set the filter to “Page path and screen class” contains “blog” (or whatever folder your content lives in)
- Export by clicking the download icon in the top right, then selecting “CSV.” Name the file “Blog Traffic” or something similar.
- Open the file and clean it up… remove the top rows of comments. And rename the header of the first column “Articles” or something similar so we don’t confuse the AI.
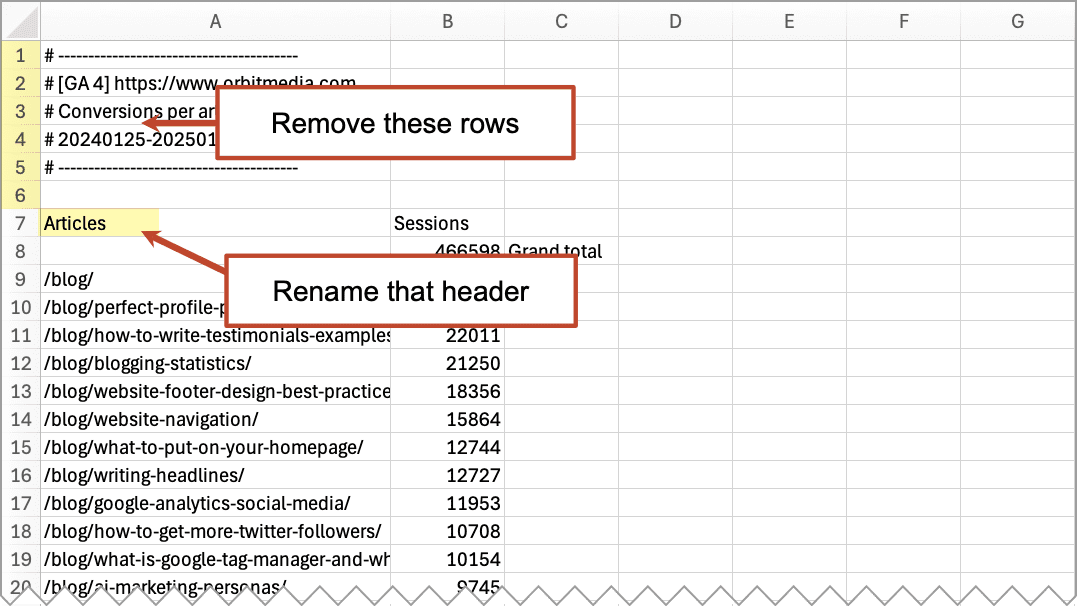
That’s it. Now you have a file showing the traffic to all of your articles. That’s the denominator in our calculation.
 |
Brian Massey, Conversion Sciences“Be careful of low-traffic posts. A post may have 10 visits and generate 1 conversion. That may push it to the top of the list, even though it’s not a workhorse post. The report can be filtered to only list posts with traffic above a certain level.” |
Step 2: Export the conversions report
Now we’ll export the conversion data. We’ll keep it very simple. Rather than using goals and key events (which may not be set up correctly), we’re just going to count the number of times each article sent visitors to the newsletter signup thank you page.
Again, here’s a screenshot of the GA4 exploration with all of the settings:

And here are the instructions. We can do it in the same exploration but we’ll make a new tab.
- Create a new tab by clicking the + plus sign next to the first tab
- Click the + under DIMENSIONS, then search for and select “Page referrer”
- In the settings column, click the + under ROWS and select “Page referrer”
- Click the + under VALUES and select “Sessions”
- Click the + under FILTERS. Set the filter to “Page path and screen class” contains “/newsletter-thanks/” (or whatever URL is for your signup thank you page)
- Click the + under FILTERS to make one more filter. Set it to “Page referrer” contains “/blog/” (or whatever folder your content lives in)
- Export by clicking the download icon in the top right, then selecting “CSV.” Name the file “Blog Conversions” or something similar.
- Open the file and clean it up… remove the top rows of comments. And again, rename the header of the first column “Articles” or something similar. AI is easily confused.
We made it! Now we have a file showing the number of conversions from each of our articles. That’s the numerator in our calculation. We’re ready to talk to a ChatBot.
Step 3: Upload to an AI and prompt
Final step! We’ll upload these two files to an AI, ask it to merge the data and draw the chart.
Why use an AI? Why not do it in the spreadsheets?
Fair question. Honest answer: I’m bad with Excel. I’m a klutz with VLOOKUPs. I don’t enjoy it and I lack the skills. And isn’t that what AI is for? To improve the capabilities of the lesser skilled? I think so. AI is a skills leveler. So I’m using it.
1. Upload the files to your favorite AI with the following prompt:
I’m giving you two GA4 reports. One shows traffic to blog posts (using relative URLs) The other shows the conversions from those same blog posts (using full URLs)
Merge these into a single spreadsheet, joining the data as you would with a VLOOKUP.
Provide link to download.
2. Important: Download and check the file. Make sure that the AI didn’t lose a bunch of your data. It happens all the time. If you ask an AI to manipulate data, you then must check that data. Look good? There should be just three columns.
3. Final step! The money prompt. Ask the AI to visualize the data with a simple bar chart.
Using the merged data, create a bar chart showing the conversion rates for the top 25 blog posts.
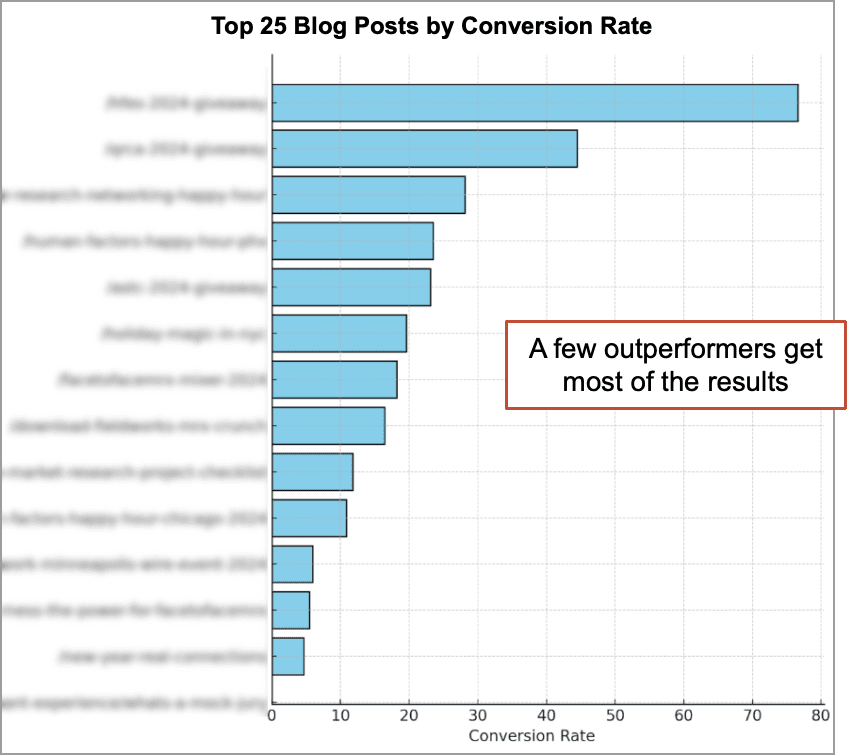
The chart will show that you have a few posts that are huge outperformers, then a big drop off and then eventually, a huge number of posts that have a zero percent conversion rate. Of course, every chart in marketing is a log-scale curve.
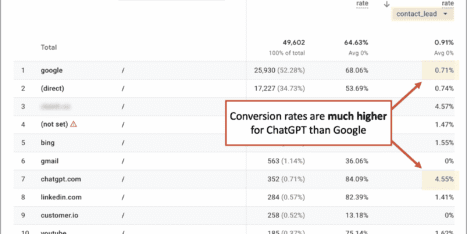
Here’s that report for another account. You can see number one has double the conversion rate of number five. Number five has double the conversion rate of number 20. And so on…
Here it is for one more account. This one is even closer to that Zipfian Distribution where number two gets half the results of number one, number three gets one third, and so on.
Find the content that grows your email list. And your email list makes you less reliant on big tech (search and social) for traffic. That’s important because big tech is sending less organic traffic to websites these days. Grow an active list and you’re more secure in your marketing future.
Email decouples your destiny from Google and Meta. Email is disintermediation.
You found your best mousetraps, time to add cheese.
Sending traffic to these is the fastest way to grow a loyal list of subscribers. There are at least 76 ways to drive traffic to an article. But here are 10 to get you started:
- Link to these posts from your top traffic posts
- Keep these posts into heavy social rotation
- Optimize these for better performance in search
- Feature these on your homepage
- Feature these at the top of your blog
- Link to one of these from your email signature
- Write a related guest post that links to one of these
- Promote these with social media videos
- Add these to a nurture sequence or your welcome series emails
- Link to one from your contact form’s thank you page
And of course, now that you know your greatest hits, you know what topics to focus on. Look at your content strategy. Are these the topics that you’re focused on? Should you cover these topics more often?
Pull back from topics with low conversion rates and double down on the topics that your readers love. You know traffic and engagement, so you can plot everything on the content performance matrix.
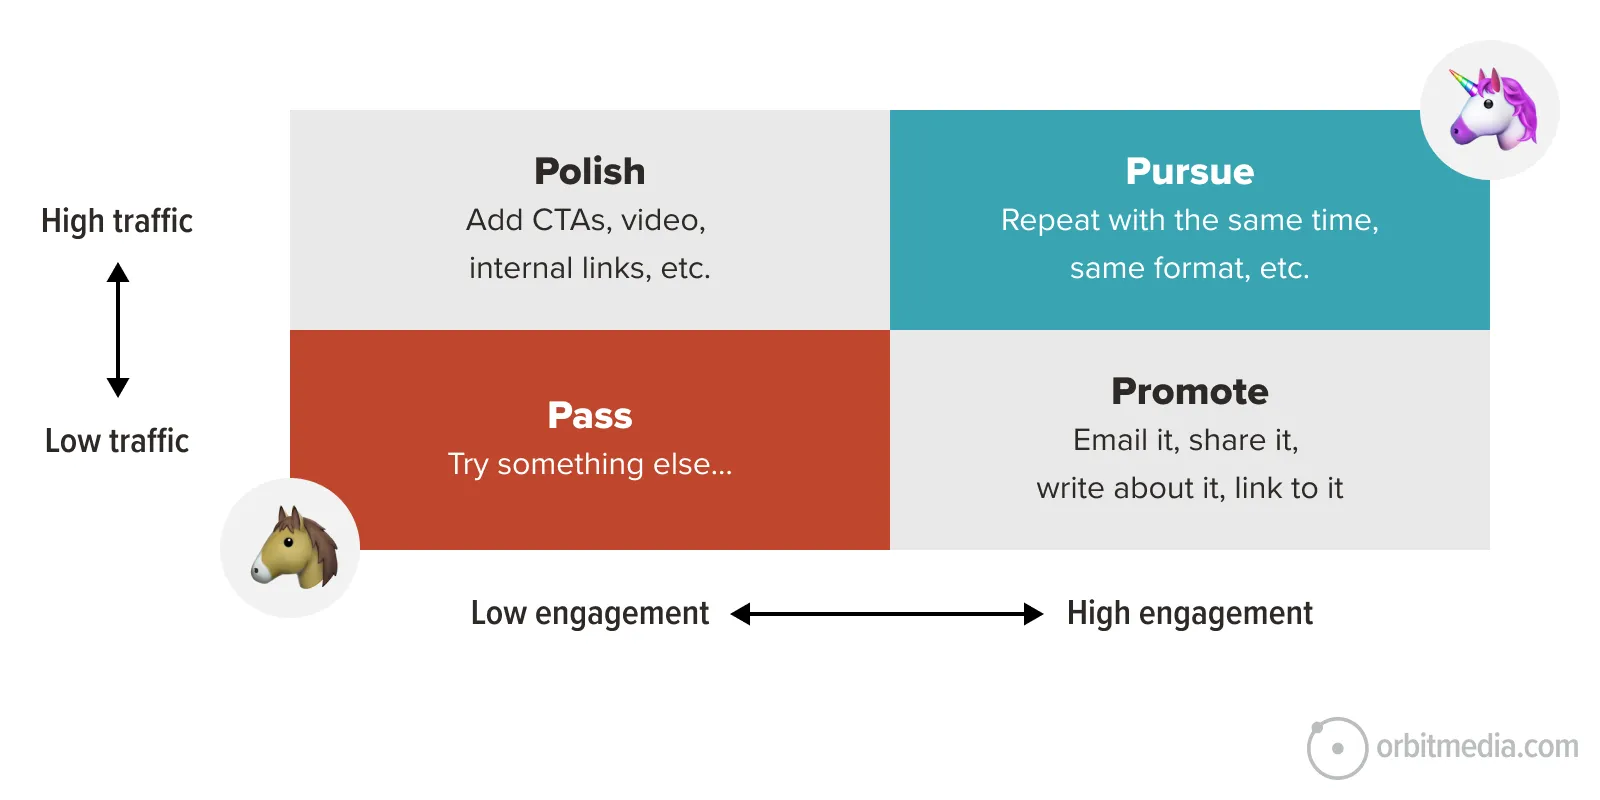
This is why you have Analytics. To find insights like these.