Your Analytics knows many things.
-
It knows what people do and don’t do on your website.
-
It knows where they go and for how long.
-
It knows so much, that it holds powerful clues about what’s missing from your website.
It’s your job to ask it questions and make decisions based on the answers.
Today we’re going to ask Analytics what’s missing from our websites. What aren’t people finding? What content gaps can we fill to get better results?
Gap #1: Visitors are landing and leaving
Let’s start with the most devastating content gap: home page clarity. It’s easy to find in Analytics. Look at the bounce rate in Behavior > Site Content > All Pages. The home page is probably at the top of the list, indicated by a slash.
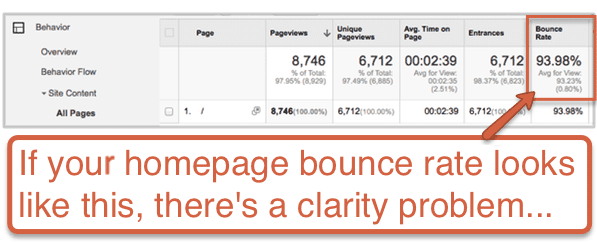
If your bounce rate is north of 60%, take a look at your home page with fresh eyes. Pretend you’ve never visited before. Now ask…
Does the homepage clearly state what the company does? Is it obvious? Is it explicit?
For many websites, it is not.
If your value proposition is not clearly stated in your featured image area, in your navigation or in your tagline, you’ve got a big gap in your content.

Clarity gap: this home page doesn’t actually say what the company does.
Quick side note, bounces aren’t always bad. Sometimes they’re fine. If the bounce is on a blog post that made someone happy by answering their question and then they went on their merry way, that’s ok with me.
A bounce on a landing page or a home page is bad because those pages have marketing goals of guiding visitors through a process that’s ultimately successful for everyone. We all live and die by the bounce rate on these pages.
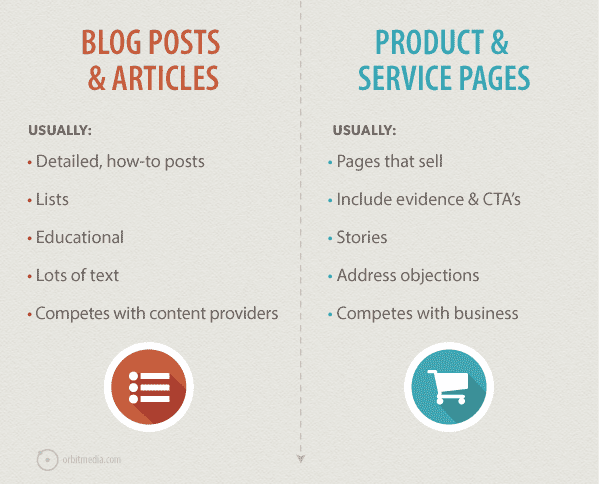
So really, there are two kinds of pages and they should be diagnosed differently in Analytics.
-
Product and Service Pages (Home page, landing pages, marketing pages)
High bounce rates are very bad. Low time on page is ok. -
Blog Posts and Articles (educational content)
Low time on page is bad. High bounce rates are ok.
Learn more about the two kinds of pages and the two kinds of visitors here. Or let’s get on with the next content gap.
Gap #2: Visitors are searching, but they’re not finding
When I say “SEO” you think “Google,” right? But there are many other search tools on the web. There might be one on your own website. If so, you can optimize your own content to rank in your own search tool.
Isn’t that SEO?
Most people don’t pay any attention to site search optimization. They never check the keywords that visitors are using on their own site. They also don’t check to see what they’re finding. Even though it’s easy to do.
If you do look, the gaps in your content will jump out at you.
If a visitor searches for a phrase but then exits the site from the search results without clicking anything, they must not have found what they were looking for.
Again, Analytics can show us the gaps so we can fill them with content. Here’s how.
-
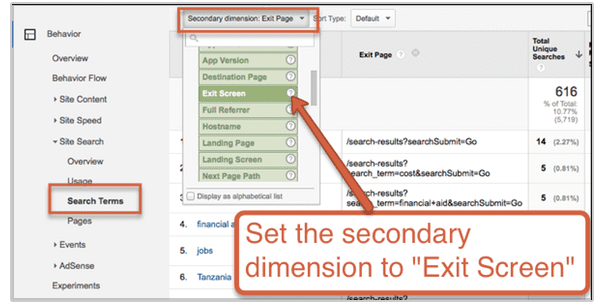
Go to Behavior > Site Search > Search Terms in Analytics.
-
Add some data to this report by setting the “Secondary Dimension” to “Exit Screen.”

-
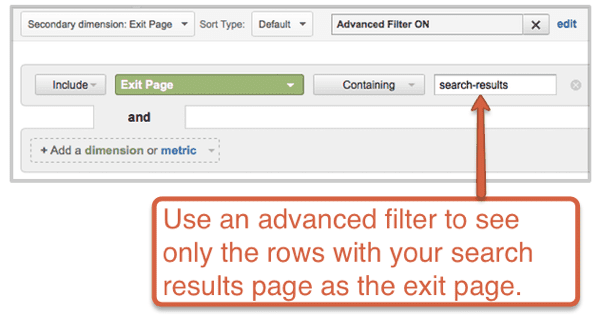
Now scroll down to the search terms that have the search results page as the exit page. If there’s a lot of data in here, just filter it using an advanced filter like this.

Note: In this case, the URL of the search results page is /search-results/ but yours may be something else.
-
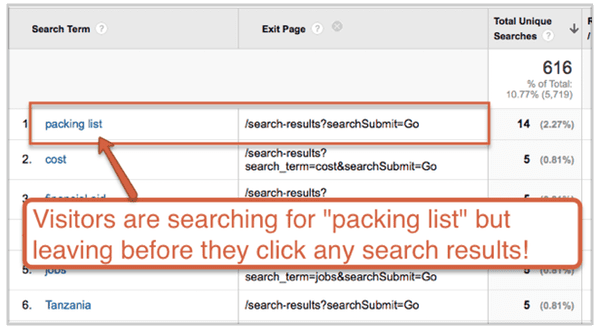
Now you’re looking at a list of gaps. Visitors searched for these keywords, but they left from the search results page before they found any content!
In this example, visitors to this travel website are looking for “packing lists,” but apparently not finding anything. Time to write some content.
Note: you’ll first need to tell Analytics to track site searches. Need a little help? Here’s how to set up Analytics site search report.
Are your own pages ranking in your own search tool?
Now you can optimize your own pages so they show up in your own search results when people search using your own search tool. That’s a flavor of SEO we can all enjoy.
Gap #3: Visitors read it and loved it, but you didn’t give them more.
What posts get the most views? Which pages are visitors spending the most time with? The answers to these questions are very important. This is how your content was consumed.
The sections on your site (and categories in your blog) are consumed at different rates. Some might be very popular. Others, not so much.
Calculating the “percent content consumption” for blog categories and website sections is very useful, but takes a few minutes. Here are the steps:
-
Go to Behavior > Site Content > All Pages.
-
Add a filter to see just the blog content. This is easy if you blog content is in a directory called /blog.
-
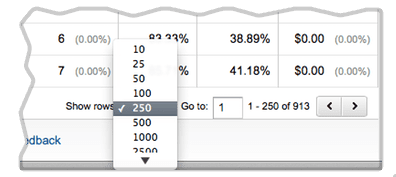
If you have hundreds of blog posts, make sure to show them all by selecting an appropriate number in the “show rows” drop down at the bottom of the report.

-
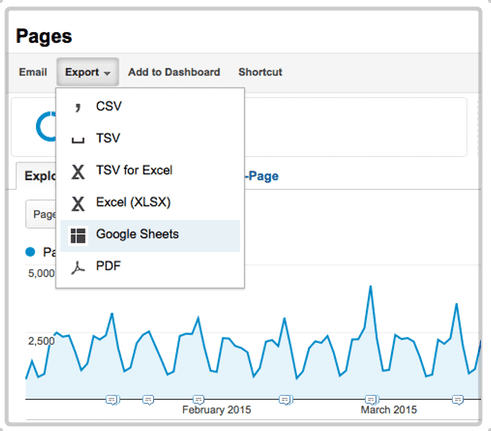
Export the data to a spreadsheet to make it easier to manage.

-
Now, in the spreadsheet, merge the data so you have a row for each category, rather than a row for each post. You can also remove the “Day Index” rows and the columns for everything but page views. Add a new column that shows the number of posts in each blog category.
This is the time-consuming part, but you’re close to discovering your final gap!
-
Now create a bar chart for the data, showing percentages for page views and amount of content published. It should look something like this.
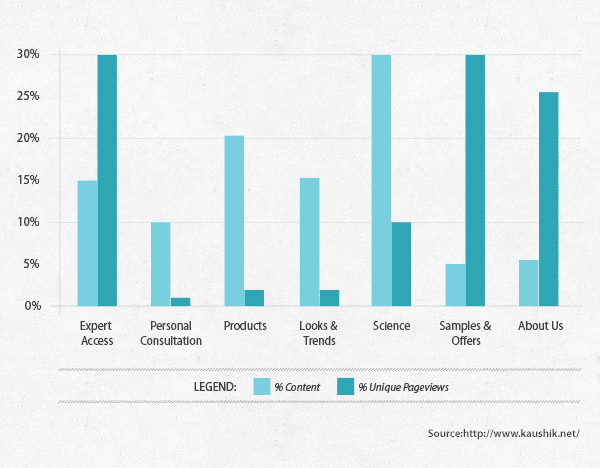
source: Avinash Kaushik
See the mismatches? In this example, there are huge gaps. What they write isn’t what people read. Probably, this site should publish less “Science” content and more “Expert Access” content. Less products and more offers.
Calculate the “percent content consumption” to see what content visitors really want
Now you can re-align your writing to their reading by publishing more of what they want. But there are other ways to correct this imbalance and close the gap.
-
Rename the labels of the website sections or blog categories.
-
Focus more on promotion and less on publishing.
-
Combine two sections or remove a section entirely.
Data-Driven Empathy
Using Analytics to learn about your visitors interests is really just a shortcut to empathy. The data holds powerful clues about hearts and minds of your audience.
Making decisions without this data would be crazy.
I’m reminded of that scene from the Untouchables when Sean Connery gives a little advice to Kevin Costner “Never bring a knife to a gunfight.” Here’s the digital version.
So if you’re not getting results, don’t just try something random. Turn your idea into a question and use your Analytics for analysis. Check the data, find the gaps and close them with better content!