There’s a saying in political campaigns: Yard signs don’t vote.
They’re good for name recognition, but at the end of the day, they aren’t really moving the needle. They don’t get up on Election Day and wait in line to punch the ballot.
Traffic and pageviews are similar.
They make you feel good. They mean you’re doing something right. But they don’t tell the whole story.
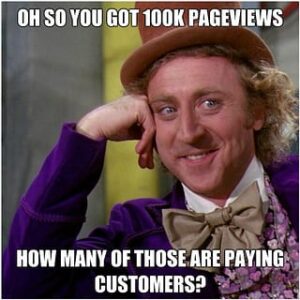
And unless you dive into the analytics of your page to figure out what people are coming to your site for, why they aren’t staying, and why they haven’t bought yet, those page views don’t mean too much.
That means we need actionable data, instead.
Luckily for you, there are analytics reports out there to give you the answers. You just need to know how to find them. Here are 13 of them in four categories: audience, acquisition, behavior, and conversions.
Audience Reports
Let’s start with the basics.
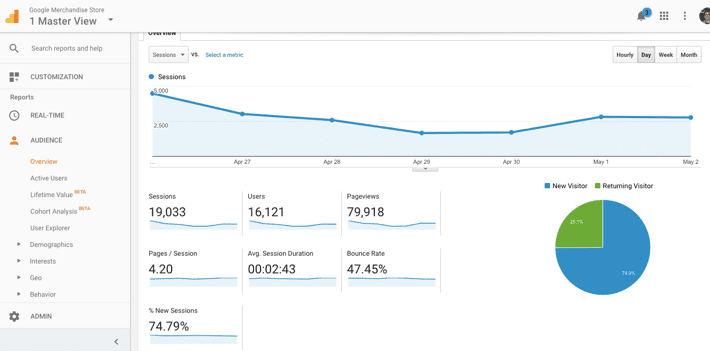
The Audience report tells you about the people visiting your site. That includes easy stuff, like mobile vs. desktop visitors. And semi-useless stuff, like Chrome users vs. Safari.
But if you dig a little deeper, there is some actionable insight lurking somewhere deep inside.
Here’s a quick look at a few of them.
1. Interests
The Demographics report gives you age and gender.
Ok, but you probably already have a handle on that stuff.
Right below that though, the Interests report can help you uncover a variety of new gems.
Like their Affinity Categories:
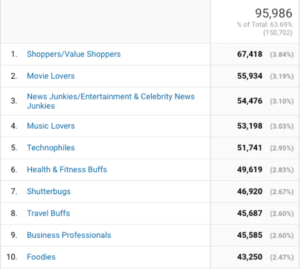
Interesting. You can take this stuff directly back to new campaign ideas, ad creative, and even content topics. Finding that intersection between what you do, and what your potential customers are already interested in, arms you with valuable insight to better attract them.
Sidenote: While you’re at it down here, you should probably make sure you’re not picking up internal company data so this information isn’t diluted.
Look at Audience > Technology > Network > Hostnames to see if all your subdomains are included. Have some you don’t recognize? You can add a filter to block domains, too. Here is some additional information on how to set up filters.
2. Mobile
At first blush, looking at mobile stats seems like a vanity metric. Something semi-useful to look at maybe once or twice a year.
However, it’s anything but. Here’s why.
Google updated their mobile page speed industry benchmarks recently. And the TL;DR version was that (1) most mobile websites are incredibly slow and (2) people won’t wait around long enough.
That results in one thing: a hit to your mobile conversions.
The Mobile Report can help you find that (while also giving you ammunition to take back to bosses and clients who haven’t been listening).
Go to Audience > Mobile > Overview and feast your eyes on something like that looks like this:
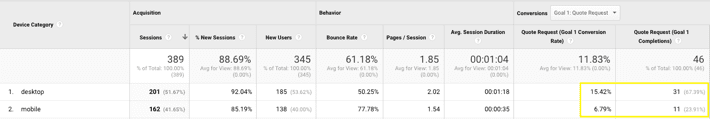
Almost twice the amount of new leads on desktop. With a significantly higher conversion rate, too.
That tells you a subpar mobile experience could be drastically killing your conversions. There’s a lost opportunity here staring you in the face.
You can calculate the loss by finding the difference in either Cost Per Lead or Potential Lost Sales from desktop to the mobile.
Acquisition Reports
Acquisition reports will help you look at data to find out which campaigns are working, and how to attribute them correctly.
Set up your acquisition report by going to Acquisition > All Traffic > Source / Medium and then select “Medium.”
Pay attention to what you see here. Are your channels and traffic really low (social, email, and CPC)? Do your direct numbers seem excessively high? You can often rule out discrepancies here if campaigns aren’t tagged properly, for example.
If the traffic numbers were what you were expecting, you might be on the right track.

3. PPC
Look beyond just channel conversions into common patterns around devices, locations, time of day, and more.
The trickiness of PPC is that a customer’s journey isn’t linear. They might click through, but not convert right away. That doesn’t mean that click didn’t add to the conversion process, though.
Simply looking at conversions of click rates and shutting down campaigns that aren’t performing based on these metrics may not be a good idea. You’re falling victim to a ‘last touch’ attribution bias because you can’t see how other campaigns are assisting those conversions.
In fact, many of your PPC campaigns won’t ever lead to direct conversions.
So instead, use PPC reports to help guide your intel on common themes, sources, what devices users are using, and when they are on your site.
Then, you can check out which campaigns are helping each other out on your dashboard: Conversions > Attribution > Model Comparison Tool. Here you can look at last interactions, AdWords clicks, and time decay to get a better sense of what’s actually happening in your account.
Still stuck? We created a custom Google Analytics report you can add to your account instantly by clicking on this link.
4. SEO
Content isn’t king. In a world where over two million posts are published daily, promotion is.
And promotion — no matter what those “social media gurus” tell you — ain’t free.
It’s anything but free. It takes sweat and resources and design and hustle and distribution… which all comes back to cash floating those salaries.
Content visits and page views, then, are useless. SEO rankings, equally so.
Instead, an SEO report should tell you which pages on your site are generating conversions.
This SEO Google Analytics report will do that.
Not only will it create a link (get it?!) between content and conversions, but it will also highlight which types of content on your site are the most popular (so you can, you know, do more of it).
5. Social
So you got 1,000 likes on your Facebook post this morning.
Awesome. That’s worth a pat on the back. Excuse me if I’m starting to sound like a broken record, but if none of those likes lead to conversions, it’s not worth much more than that pat.
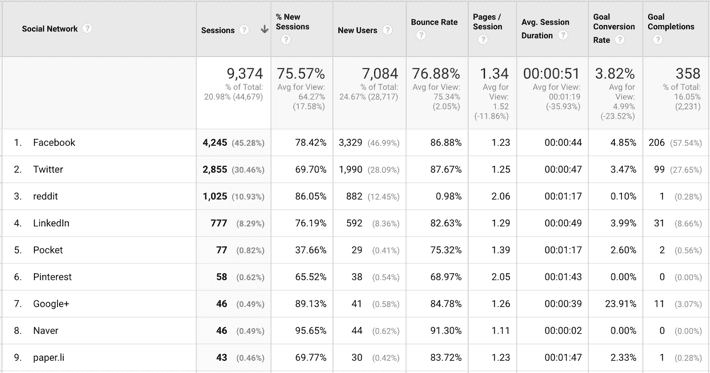
The Social Media Google Analytics Report will show all the social media channels that are producing traffic to your site, and what, if any, are leading to conversions.
6. Referrals
‘Soft’ metrics like branding is fine. Traffic or sessions are OK for vanity. But which referrals (from web mentions, PR, guest blogging, etc.) are also bring in the highest quality conversions?
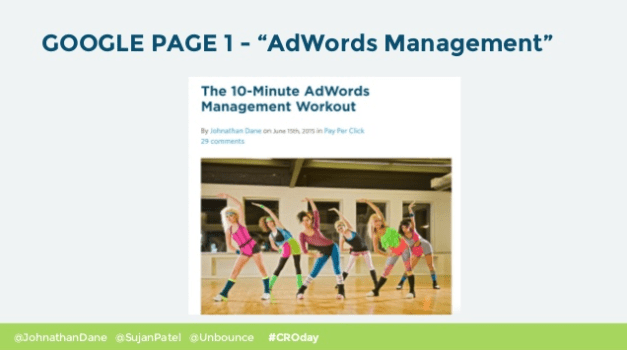
In the short term, you can piggyback on other’s audiences and domain authority to build up your brand. For example, The 10-Minute AdWords Management Workout leveraged Unbounce’s already-high authority in the space to quickly take over the number one position for “AdWords Management.” And guess whose face was at the bottom of that post?
Other companies can practically hand you their audiences on a silver platter, increasing your own visibility. Writing content for new groups (as long as it’s information they want and need), is going to bring new visitors to your page.
Behavior Reports
The Behavior section tells you all of the ‘stuff’ that’s happening between when people come to your site, and before they convert.
So you can see how often they visit your site and how engaged they are when they’re there.
Two quick issues to double check before diving into the reports:
- Make sure you’re not collecting any Personally Identifiable Information. For this, go to Behavior > Site Content > All Pages and search for “/@”. This search will sift through URLS to find @ symbols and will let you know if you have inadvertently collected an email address. No @’s, and you’re fine. If a few come up, make sure to change the settings.
- Double check for parameter fragmentation. Google Analytics will divide pages (into rows on the same output) that have different parameters. Fragmentation won’t allow you to analyze the full page’s content, so this will need attention. Go to Behavior > Site Content > All Pages report to find the page you are looking for. If you’re seeing a lot of fragmentation, you’ll need to check your analytics setup. Don’t fret– this is an easily solvable problem.
Got those two out of the way? Good. Now you’re ready to dig in.
7. Content Performance
Content does a few things.
It brings people into your site. It helps them understand the value you provide. And then it gets them to landing pages to convert.
Don’t just look at popular content, but reverse engineer what’s behind each. Figure out what categories and topics your users like most. Were those case studies? List posts? 1,000 words or 3,000?
Look for actionable trends and patterns that you can isolate to apply across the new stuff you’re about to work on.
You can evaluate content performance through this Google Analytics report, which will show you an in-depth look at your top performing content.
And even better, it will help you sort content by page value (through conversion tracking and conversion rates per post).
8. Landing Pages
Landing pages inside Google Analytics are a person’s first interaction with your site.
These are the ‘Entrances’ that where users are entering your site, why they are (or aren’t) converting, and how to fix it.
You can go to Behavior > Site Content > Landing Pages. Here, you’re gonna want to pay close attention to bounce rates — are they really high? Really low?
Look for errors first. For example, a 0% bounce rate could be just as bad as a 100% bounce rate. If your report is giving you numbers that look a bit off, you probably have an error in your event setup. Find out the many ways you could have done something wrong here.
Next, apply context. Because often times you’ll find that things that seem bad on the surface, aren’t.
For example, a high bounce rate on a landing page designed to get people to opt-in for a free eBook might not be a bad thing. You don’t want them to linger. There’s not much to see beyond the headline, subhead, bullets, and form.
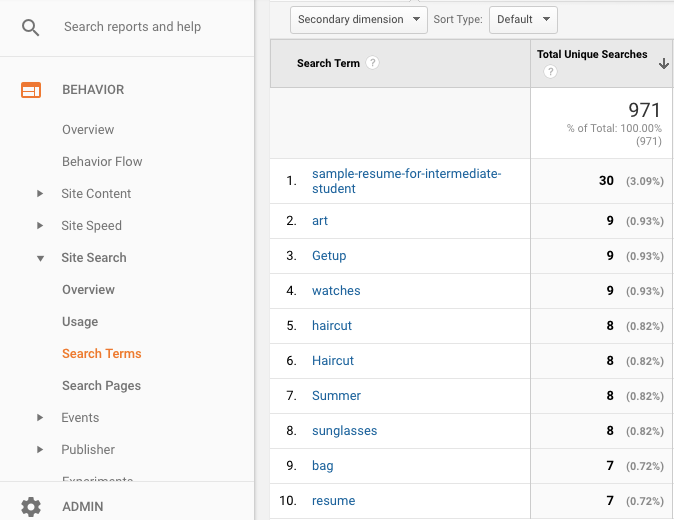
9. Site Search
People will tell you what they want. Sometimes, they will literally spell it out for you.
Behavior reports can show you your site’s search history. Set it up in the administration section: View Settings > Site Search.
Allow site search by selecting the search query parameter, and make sure to select the lowercase filter. This will combine the results for two searches that are the same, but performed in different cases (like “Mobile phone” and “mobile phone”).
Then you watch trends over time and see what people are literally asking you for. This is often a great place to find new content ideas, what FAQ’s to add to your landing pages, or what new product and service variations to try out.
10. Events
Events are commonly those ‘micro’ metrics that happen right before a needle-moving ‘macro’ one.
For example, key content views (like video plays or even CTA clicks on an e-commerce shopping guide) can help predict user behavior.
Getting them to eventually buy is tough. It’ll take work. And it commonly requires them to interact with these steps in the middle before they’ve built up enough interest to eventually pull out their credit card.
You can audit your event tracking by going to Behavior > Top Events. These events should help you find the answers to what information your company wants to track, and how it will lead to better decision making in the future.
For more information on anything and everything you need to know about events, check out this guide.
Conversion Reports
Every single report so far has lead up to this point.
Conversions are the reason we do anything. The reason for tracking and monitoring and reporting.

So here are the big ones to prioritize.
11. Goals
Site-wide conversion rates aren’t very helpful.
Instead, you’ll want to dig deeper into which sources your conversions are coming from.
Setting up identifiable Goals will do that, helping you sort by Source / Medium to track your marketing activities back to the results they’re delivering.
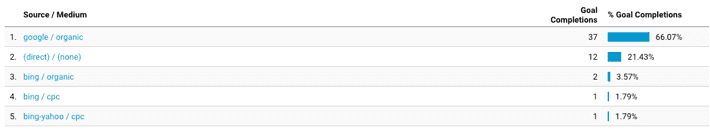
Ideally, you want to reduce that Direct number as much as possible. Otherwise, Dark Traffic will take over.
For example, Google Chrome is forcing all websites to setup SSL certificates. Which is a good thing for consumers! But a bad thing for your analytics, as redirected traffic (from HTTP to HTTPS) can often strip away the referral data you’re relying on.
Instead what happens? Your organic search, social, email, and even ad results are being lumped under Direct.
12. E-commerce
Viewing product sales should be easy enough, right? Except many times the numbers here don’t match your own internal store data.
In an ideal world, they should be between 95% and 99%.
If not, check four areas on your Analytics:
- Did you set up ecommerce tracking properly?
- Are your shopping cart and Google Analytics configurations in the same time zones? If not, you’ll get mismatched data.
- Did you get up tracking later in the day? Any purchases made before then won’t show up in Analytics.
- Have you had a lot of canceled transactions? They won’t show up in Analytics. Neither will transactions that don’t have a value.
Digging deeper into the e-commerce report will also help you see how site changes affect conversions. For example, e-commerce company Spearmint LOVE found out that accepting PayPal can improve checkout conversions 44%.
That’s a significant boost that would have otherwise gone unnoticed (had you not been looking for how changes on one side affect the bottom line.)
13. Attribution
Google Analytics naturally defaults to a ‘last touch’ attribution bias. Here’s why that’s bad.
It’s pretty hard to pinpoint any one reason a person made their way to your site, or what the catalyst was for their final conversion. The buyer’s journey is a long and winding road.
You can use a Top Conversion Paths report to see the path that a visitor took before clicked the “buy” button. This will show you how each source is performing and what marketing is performing well.
For this, go to Conversions > Multi-Channel Funnels > Top Conversion Paths. Select “All” for the “Path Length,” and then you’ll be able to see all your data.
Switching attribution models, though, like we did earlier in the PPC report, help you uncover those hidden, assisting steps required to drive conversions.
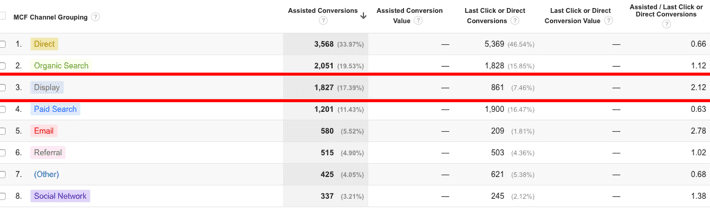
Display ads are a common example. If you only looked at Display results for Goals or e-commerce conversions, you’d be sadly disappointed. And you’d probably slash their budget.
But a quick view of the Model Comparison Tool under Attribution will show you that they’re integral to people discovering your site for the first time, and then coming back to your site when they’re finally ready to purchase.
Conclusion
You want to make sure your hard work is paying off. And not spinning your wheels doing something that’s not.
Google Analytics data reports will help you figure this out… but only if you know where to look.
Because a lot of the stuff that tends to get our attention, like sitewide sessions or page views or bounce rates, aren’t actually all that actionable.
Instead, we need to dig a little deeper.
These 13 reports listed under Audience, Acquisition, Behavior, and Conversion help you find the truth. They’ll give you a complete, ‘full funnel’ view of what’s happening — without the flaws that commonly plague our data without even realizing it.
Good data isn’t for reporting. But for finding the problems faster, fixing the problems faster, driving up your revenue faster.