You probably get the same unsolicited biz dev emails I do – the ones that seem personalized, and are designed to schedule a meeting.
They usually look something like this…
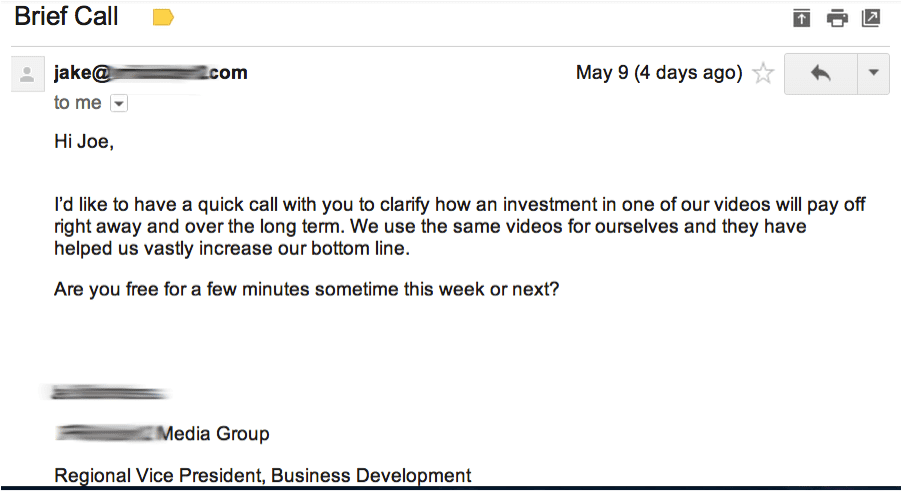
And they almost always come in multiples (at least until you respond)

I’m a bit of a mischief-maker – so I like to respond in a non-traditional manner…
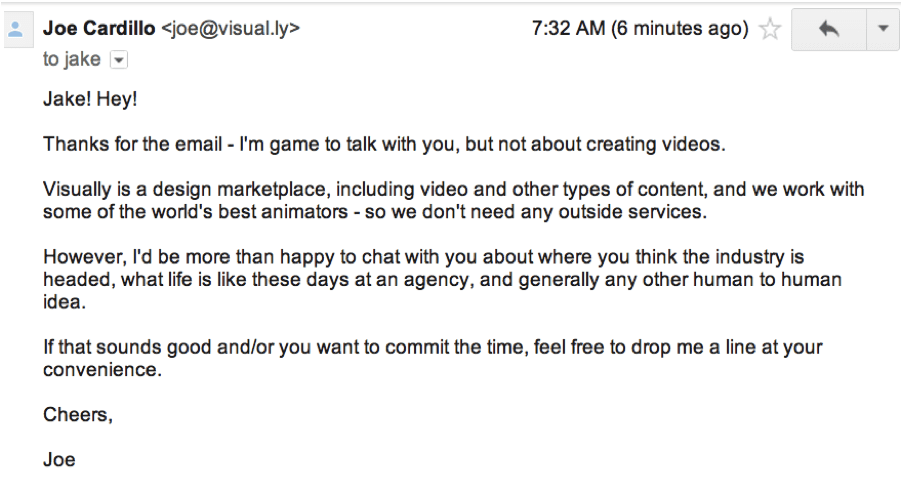
You can see how a bunch of these in your inbox would get overwhelming quickly – but I actually like this type of email for a couple of reasons.
Good CTAs reduce junk data
One reason is that the call to action is easy to figure out from both sides.
Jake thinks his product can help me, and in the course of a few emails he dropped just enough information to explain why. Since I don’t really need his services it was easy to explain to him why, and opt out.
This is true whether you’re doing direct email or landing pages. One of the biggest problems a marketer will face isn’t to amp traffic (always important) but to reach a prospect that actually wants or needs what you’re providing. If you’re getting 100 lead forms per day but only 10 of those are to relevant prospects, not only does your team have to sift through responses, but it also skews your measurement for what is working.
Clear, relationship based metrics help you test in ways that matter
The other reason I like it is because it could easily be converted to a clear, relationship-based metric.
The email Jake sent me is likely going out to a seriously high volume list. It’s only moderately personalized – a more segmented list might have wiped me because the Visually Marketplace actually includes video production.
But the metric you can pull from it is a good one.
The best metrics are easy to understand, actionable, and comparative.
This is a key component of lean analytics / lean startup methodology. The discipline has traditionally focused on early stage growth and product/market fit – but is now starting to be used by B2B and content marketers as well.
In Jake’s case, the metric would revolve around starting conversations.
For example…
My hypothesis is that semi-personalizing emails and asking for a conversation will help drive quality leads…. for every 500 I send, I expect around 40 meetings, and 13 will end up purchasing from me (~2.5% conversion).
Jake could take his hypothesis (jumping right to leveraging actual conversations drives purchases) and test it out as a clear, relationship based metric. For marketers that’s akin to “If I increase X, I expect Y to then drive Z” – and that’s a whole lot better than “our goal is 14% more leads this month” because if you don’t increase leads by 14% and never setup a relationship metric, it’s pretty hard to examine results in a meaningful way.
This particular example is focused towards sales but a more marketing focused version could be about testing what your audience considers useful content.
To make it easy, let’s say you borrowed from Andy’s recent video that included quickly defining a content strategy for a sports stopwatch business.
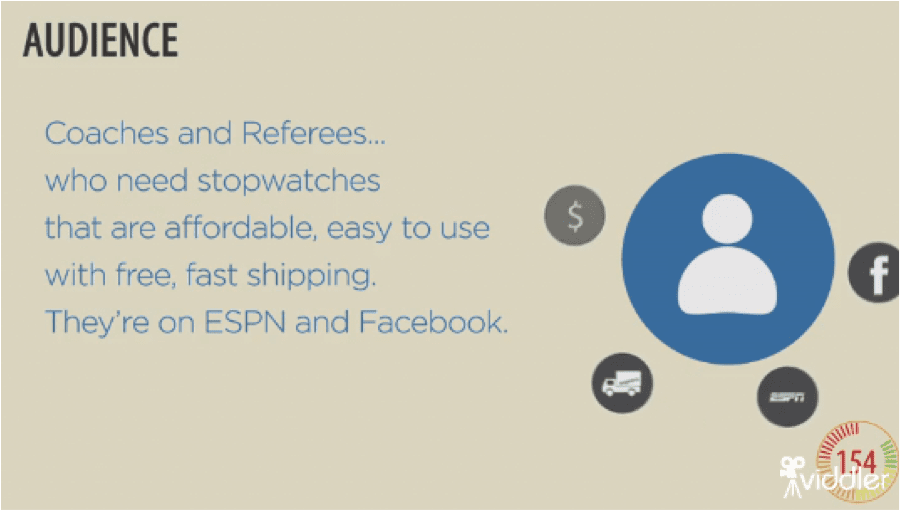
Andy recommends that you find some topics that coaches and referees might find useful – they should be informative, useful, and even a bit entertaining.
Perhaps you’ve done some keyword research, engaged in customer development with prospects, or even talked with current clients – and now you’ve got a list of some potential topics.
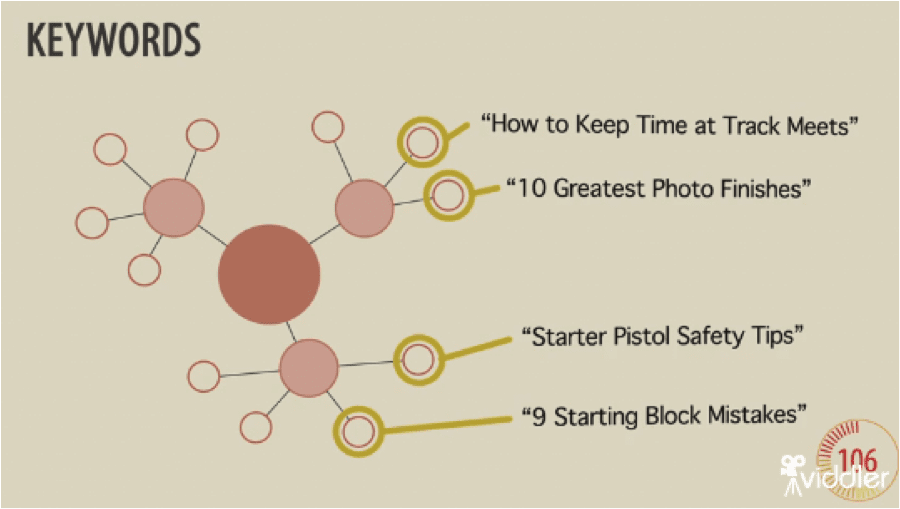
From here, divide them up into categories – and decide the ratio for each that you’ll be using when publishing / distributing the content.
For example…
After doing some research, the greatest demand seems to be for how-to’s. I’m going to focus on useful posts as my most important category, then informative, then entertaining.
My hypothesis / metric will look like this:
If I share useful content 80% of the time I expect views of our posts to increase by at least 50%, which will increase qualified sales inquiries by 3.5% in the next 7 weeks.
Of course, those numbers may be different depending on your research – but the point is that they are easily testable and relationship based. If they don’t work out, you have information you can use to go back and change your own behaviors / actions, and in turn those of your audiences.
Here are 3 more relationship-based metrics to experiment with:
1) Stickiness
This is one of my favorites – basically, how likely is a user to come back for more?
Social networks and B2B products use it all the time – Facebook, and Twitter, for example, are constantly tweaking internal algorithims… “if we can get a new user to take X action at least 5 times in the first week of use (say, add 10 friends) they are Y percent more likely to become an engaged user.”
2) Virality
This is a bit different than the typical “how can I make my video go viral” question and is often intimately tied to stickiness.
It refers to the likelihood that a user or client will share and evangelize your content, idea, and/or product. Box.com, for example, is known for their growth hacking technique of offering you more storage in exchange for inviting your friends to join.
3) Personalization
For B2B marketers this is a fun one to play with. I noticed an interesting example in Christopher Penn’s email newsletter recently. He offered premium content in exchange for filling out a profile on his site.
This is cool because it could be used in a bunch of ways – for ex. social proof (look how many other people are engaged with my content), but also as a way to get people to specify what they actually want. The metric here could easily be structured as something like “If a user fills out their profile in exchange for premium content, they are X percent more likely to read 1 or more articles within 3 weeks.”
If you’ve been able to convert a confusing variety of results into clear, actionable metrics we’d love to hear more about it in the comments below (and your fellow marketers thank you in advance).


