After reading this recipe, you’ll know how to measure the marketing performance of a website that does not sell online. You’ll learn a goal value methodology explained through a case study that outlines:
- All you need to succeed, including the tools
- Step-by-step of how to define the goals and their values, set it all up, analyze and report the data, then make data-driven decisions
Last but not least, reading this will give you a unique opportunity to work at your computer while wearing that funny cooking hat your loved one got you for Christmas. The one you need to put on to show them you love them, too. Hit start on your favorite playlist, it’s time to get your hands dirty.
Ingredients
1. Website with high-value actions other than sales
Do you promote high-ticket items where form submissions would be a distraction because phone calls are what your client actually wants?
Do you run Facebook ad campaigns that promote your blog content and a variety of related optins?
Do you collect a few different types of leads via free tools or resources on your website?
If you fall under any of the above or many other possible instances with the presence of non-sale website actions with high marketing value, you face the same challenge we faced when setting strategy for our stem cell clinic client thriveMD. I’ll use the client as the case study throughout the article.
The clinic harvests your own adult cells, then processes and injects them into your deteriorating joints or back. As much as the therapy is becoming more and more popular, price tags are not low and general awareness about the benefits is still lagging.
The best way to generate bookings is to get a high amount of phone calls from targeted prospective patients. Such phone calls, as well as website actions leading to them, are of marketing value to us.
2. Team with high appreciation for data-driven decisions
There is no point in setting up or analyzing goals if you or your team will not act on the insight. But, it’s in your power to nourish a data-driven mentality of your team.
If you work in a marketing agency or department, and you think your team is a lost cause, go be the hero and save the day. Show what data-driven marketing can do by acting on stellar visualizations, optimizing campaigns where no room for improvement was anticipated, explain which KPI really matters. Clients and bosses do listen to professionals who take initiative and instill confidence.
3. Google Tag Manager framework for event goals in Google Analytics
We used an analytics implementation package by MashMetrics, above all because of its rich and easy-to-customize list of Google Analytics events pushed through Google Tag Manager (GTM). The most useful events tend to be clicks on certain links, optin form submissions and phone calls. You’ll see examples below.
4. Forwarding numbers for phone call tracking
We use CallRail for a few different projects and it works great. It integrates with GTM and a plethora of other important tools. Data is rich, customizations easy.
5. Data visualization tool
There are many premium dashboard tools that you can use – with Databox at the top of my list. But, there’s also the free one that’s been getting better and better. In fact, I think that there’s very little out there that compares to Google Data Studio when combined with Google Sheets or Supermetrics. You’ll see chart examples below.
Instructions
1. List out all website actions that bring people closer to becoming a patient/client/prospect
For new projects, run a thorough discovery. For projects you’ve been working on for a while, check all your facts and audit your own understanding of how you think people progress down the funnel.
For the clinic, we decided to focus on actions that bring people to doing one or all of the following:
- Pick up the phone
- Indicate a strong interest in contacting the business
- Capture contact info
- Promote word of mouth
With that, we created this list of actions and goals:
- First-time calls – lead to most new business
- Repeating calls – also highly valuable
- Call-back requests – capture contact info and explicitly ask to be contacted
- Blog subscriptions – capture contact info and indicate trust
- Video views > 50% of the video length – patients who book often mention they’ve watched the patient testimonial videos
- Email link clicks – typical for inquiries higher up the funnel
- Social share clicks – spread the word
- Views of a Contact Us page – a subtle but valuable indicator of interest
2. Determine the Goal Values
In this step, you want to set goal values that compare one action to all the others on a scale of $10 to $100. $10 is for actions that are still valuable, $100 for the most valuable actions on the website. You could use many other ranges, but $10-$100 is both flexible and simple enough, allowing for good analysis.
What you are trying to do is to set values that represent how well your marketing did. You are NOT trying to show the client how much money you made them. It is sufficient to create a way to compare marketing results from month to month, campaign to campaign, channel to channel, segment to segment and content group to content group.
Here’s what we decided based on existing GA data and conversations with the clinic’s director:
- First-time call – $100
- Call-back request – $60
- Repeating call – $30
- Blog subscription – $30
- Video views > 50% of the video length – $30
- Email link click – $20
- Social share click – $20
- Views of a Contact Us Page – $10
3. Setup form and click event tracking in GTM
Here I’ll assume you know your GTM basics. If you do not, start with Amanda’s GTM intro.
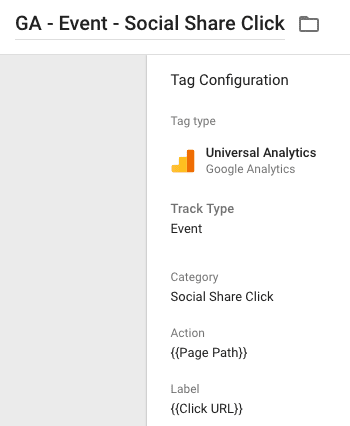
The most important parameter to set up will be Category. That’s the one we like to use to count GA events as GA goal completions. You’ll also use the Action and Label parameters, namely so to get deeper insight on how the goal completion happened.
Here is how an event for a goal from the list above looks in the clinic’s GTM. We use Category to identify goal completions in GA, Action for seeing which page was shared, Label for seeing which platform the link was shared to. This is all based on the code of our social share buttons.
4. Setup phone call tracking via CallRail and GTM
There are great WordPress plugins for integrating CallRail on your site, but we recommend doing so via GTM. One, it leads to more flexibility. Two, it’s best to have all your tracking tags neat and tidy in one place – your tag manager.
CallRail will replace your actual phone numbers with a set of numbers you pay for. You’ll be able to track information on area codes, call lengths; you can even record your calls or automate some of your phone call answering if you wish.
A drawback is that your CallRail numbers will go away when you stop paying for the service. Be transparent to your client or team about it so nobody gets surprised later.
Phone call tracking is very common in AdWords. That is to your advantage if you’re facing resistance. You can use call tracking via AdWords first, then tell your client or team that you can reap the same data benefits with CallRail – but for all of your channels, and with much more depth of data.
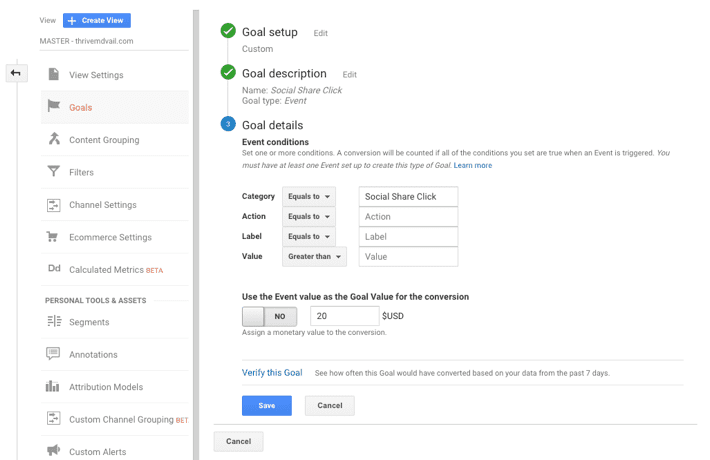
5. Set up goals and goal values in Google Analytics
Use:
- The same goal name as the tag name in GTM
- Event as the goal type
- Category as the parameter that identifies a goal completion
- Goal value entered in GA, not in the GTM tag
GA goal settings for the aforementioned social share click goal then look like this:
We set up the other form submission and click event goals in a similar fashion. The Contact Us page view goal is set up as a Destination goal.
CallRail phone calls are set up as Events as well. Compared to CallRail’s own GA goal setup guidelines, we added a Repeating Call goal. For that one, we used a regex that says that every phone call that is not a first-time call should be counted as a goal completion: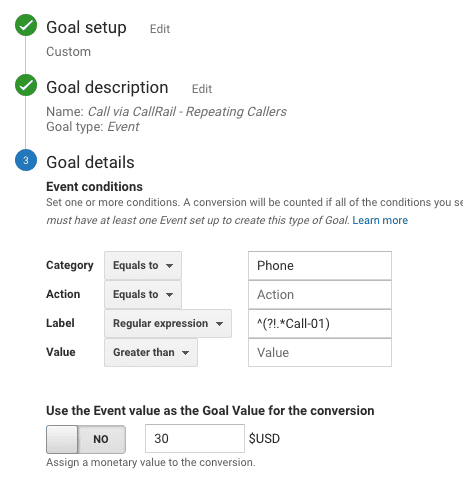
6. Setup visualizations in Google Data Studio for easy analysis
You don’t want to make reports that get auto-emailed on a semi-thoughtful schedule. You do want to present data with your own, human analyst touch, and to facilitate acting on the data. Enjoy the process, bake in your own thought processes, visualize the story in an engaging way.
In our example, the left chart below shows the growth of traffic data and gives great context. We know we’re growing and breaking traffic records. But, that doesn’t say enough about the impact our marketing has on the business. We do not know whether we should try and grow further, or whether we should improve results with the traffic we already have.
The right chart shows the growth of the total value of all goals completed on the website. You can see that in the recent months, the value of the actions people take on the clinic’s website didn’t grow as much as traffic volume. It even got stagnant.
We are still doing well, the value stayed high. But, we are experiencing growing pains and we should be able to get more out of the surge of traffic.
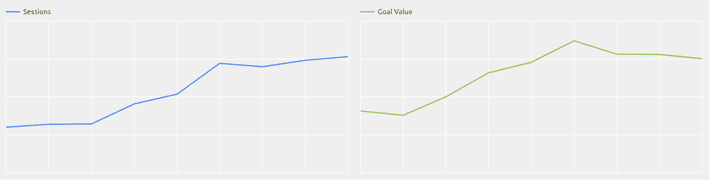
The conclusion is that we do not need to grow traffic further, as that may not lead to growth in actions that lead to patient bookings. Instead, we want to improve results from the traffic we already have.
In our campaigns, we should work on better targeting and ads that set clear expectations – not on growing the number of clicks. On our website, we want to work on the quality of existing content and smooth user flows – not on new SEO magnets.
7. Report the data to decision makers on your team
Now that you have actionable data and visualizations up your sleeve, go share them. If you try to explain your goal value method earlier in the process, your client or boss may and may not agree with your intention.
This also is a good time to test your assumptions about how valuable the different actions are. Following the example of our clinic, I knew we set the values right once our goal value chart corresponded to how booked out they were.
8. Act on the data
Now you have your measurement process down. You also have your visualization process down. It’s time to go indulge in your healthy new recipe, to go make your marketing better and better over time, with the help of data.
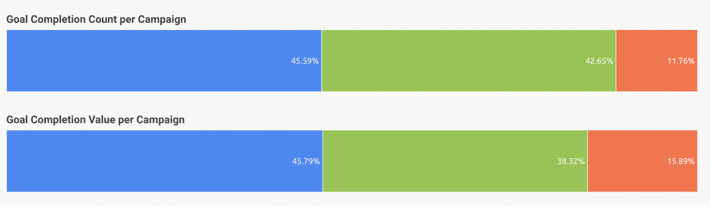
To exemplify, the charts below compare conversion counts to goal values generated by two samples of the clinic’s ad campaigns. We are interested in several different website actions, so the first chart is useful because it tells us which campaign generated more meaningful website activity in general. This is important context, as well as a sign of quality ad clicks.
The second chart shows how valuable the generated actions were. Without goal value analytics, non-ecommerce actions often get lumped together too much. But here, the visualization of the orange campaign provides actionable insight.
The share of goal value it generated is bigger than the share of goal completion count it generated. Its goal completions tend to have a higher average value than the goal completions of the green and blue campaign.
This opens up useful questions about, e.g. user intent, ad quality, ROI, budget allocation. The orange campaign is quite likely a good candidate for a bigger budget, even if that’s at the expense of the green campaign.
Besides using this goal value approach to compare campaigns, you can use it to compare landing pages, advertising platforms, segments, etc. Just remember one thing when comparing shares – the human brain is better at understanding lines than circles. Use bar charts with 100% stacking instead of pie charts.
9. Create an ongoing routine of acting on your data
You truly only benefit from analytics if you put your data to use. Further, you benefit more and more if your analytics is at the core of your marketing work. We recommend using 10-15% of your marketing time and budget on measurement and analysis. It is an investment that makes all of your marketing better very fast.
For the clinic, our team discusses data insights on a weekly basis. With the client, we go through charts on a monthly basis. During the conversations, we decide what content, campaign or website feature we should work on. We know what value our work created, why it did, and what we can do about it.
Summary of health benefits
- A partial alternative to user-level tracking. Instead of using cookies and finding ways around GDPR, you may prefer assigning low goal values to actions at the top of the funnel, then high goal values for actions at the bottom of the funnel.
- Marketing decisions based on accurate, actionable and accessible data. This means your marketing will be getting better and better over time and you will be one of those cool marketers who make the internet a better place for all. Not one of those lousy marketers who spray and pray.
- Clarity. Once you start talking in value generated, there will be no more doubt about whether your marketing is working or what you should be doing next month.
- Better cardiovascular health. You’ll achieve better results in less time, meaning you’ll have more of your day left to ride e-bikes, take sunset yoga selfies on the beach, cook food from scratch, or scoot over to the local farmers market.
- Better financial health. When doing marketing that optimizes for tangible value, it is easier to charge per value you create instead of charging per hour.