What metrics should I be looking at? What should I be tracking? How often should I look at Analytics?
These are some of the all-time greatest questions in digital marketing. There are so many numbers in so many places. Content marketing metrics are confusing, distracting and overwhelming.
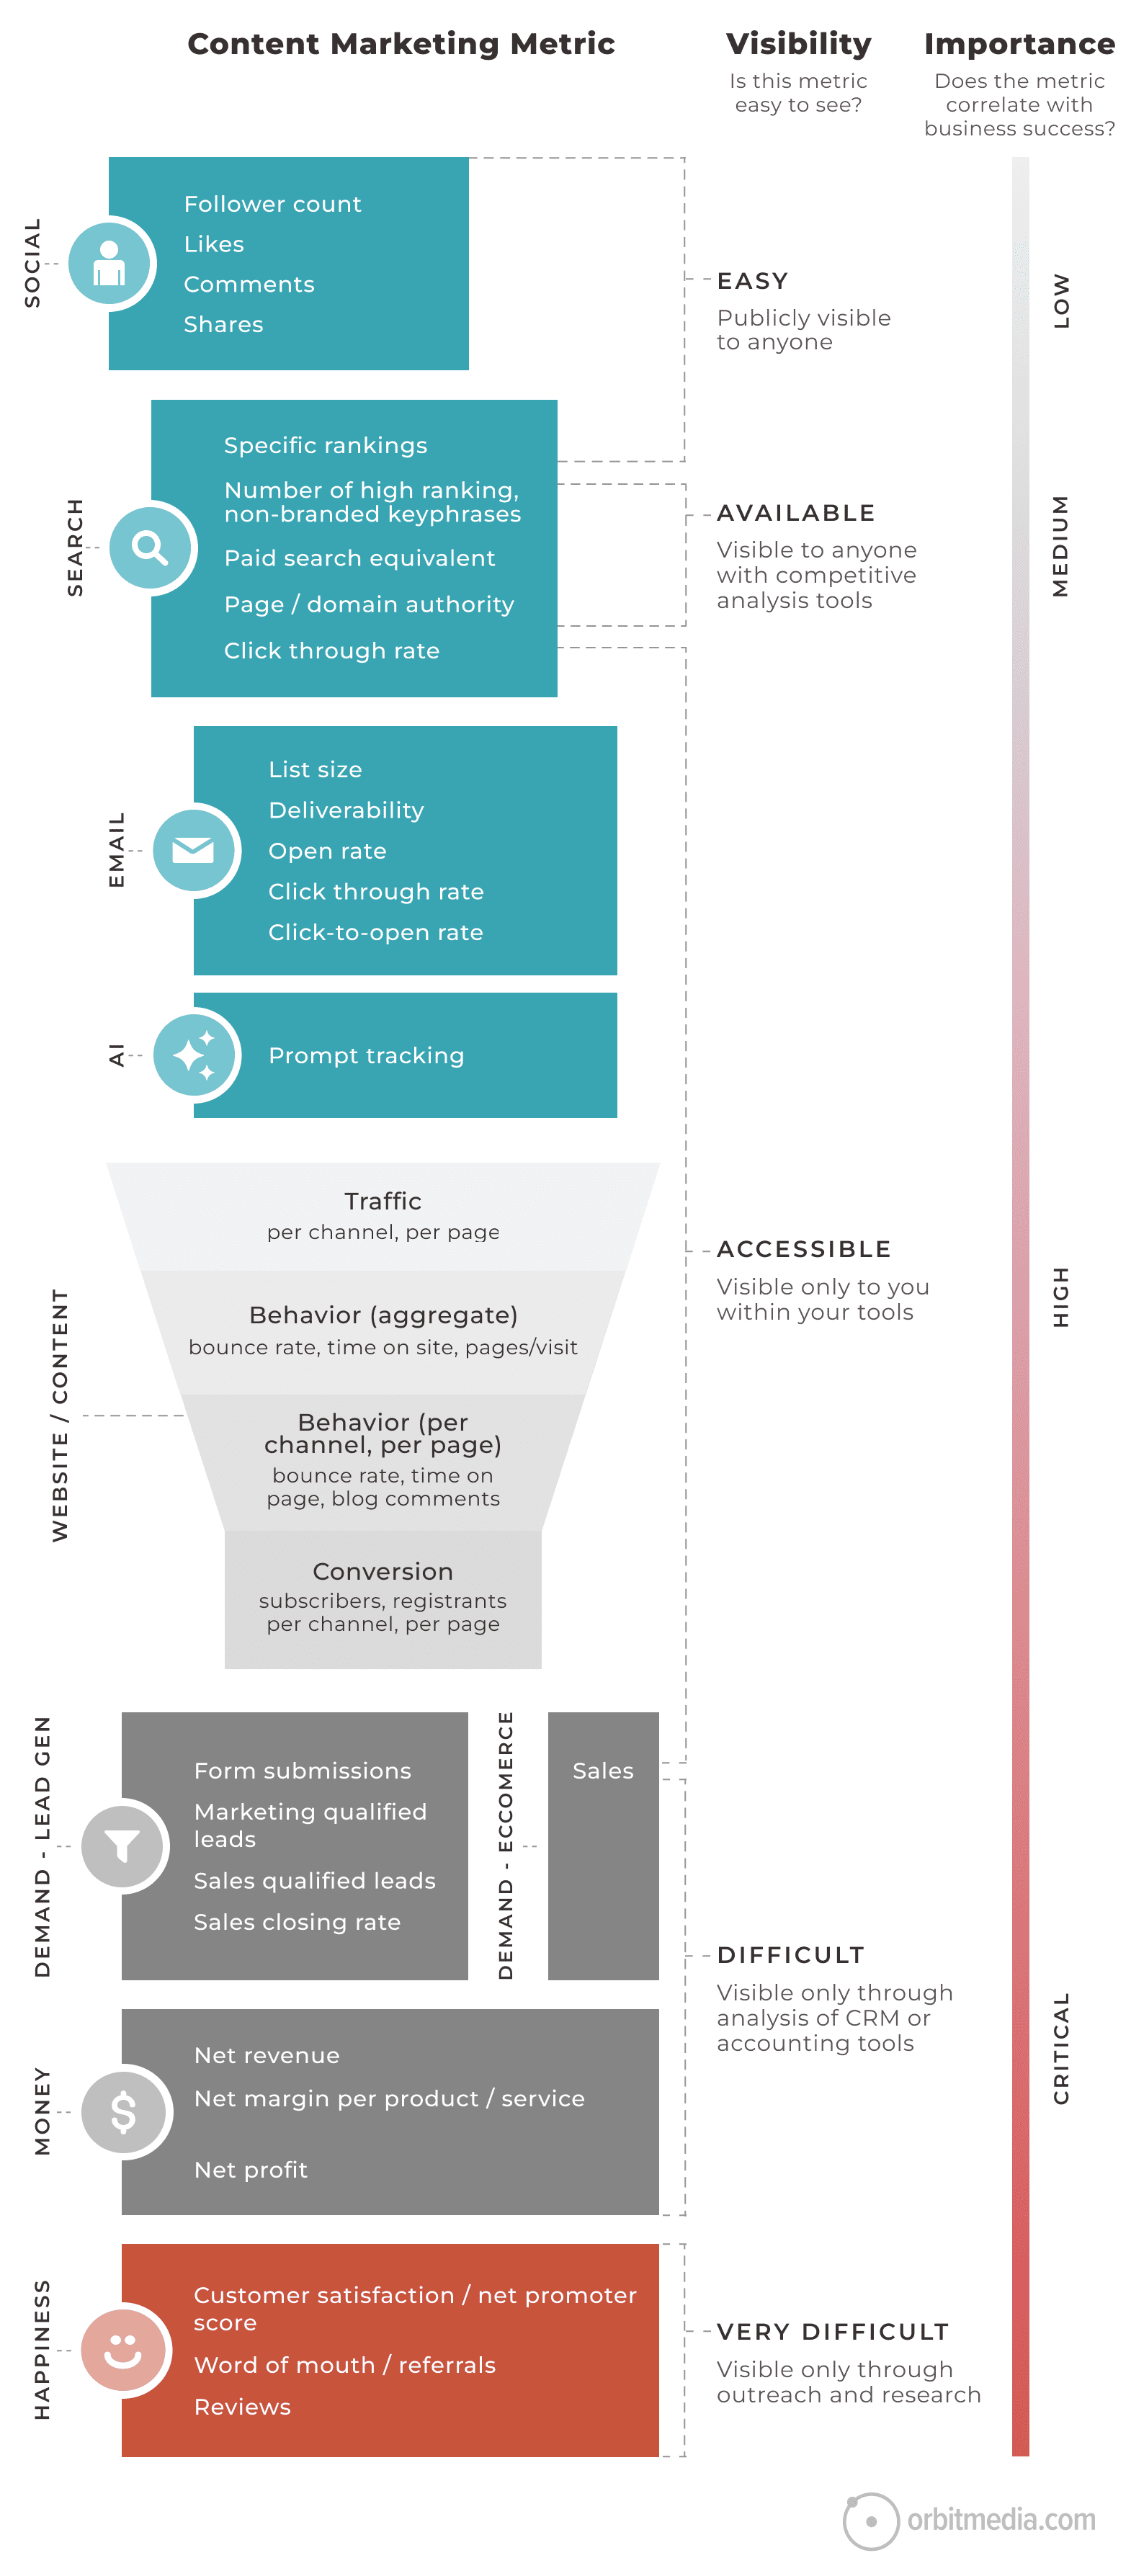
This guide lists 37 content marketing metrics, from the tippy-top of brand awareness to the bottom line and bank account. But this chart also shows two aspects of each marketing metric:
- The visibility of the metric
Is the metric easy to find? Is it available to the public? Do you need tools? Or do you need to do research to uncover it? - The importance of the metric
Is it important? Does the metric correlate with business success? Is it likely to affect financial outcomes?
And you’ll quickly notice the relationship between the visibility and importance. Coincidence? We’ll get into that more in a minute. But first, here’s the guide…
Yes, we went beyond content and marketing, into sales and service. But it all connects back with word-of-mouth marketing (referrals) and reviews (social proof).
Julian’s Law: More visible = Less important
Some metrics are easy to find; others are hidden. Some metrics are trivial; others are absolutely critical. Now here comes the connection and the irony of marketing metrics. It’s a trap for marketers.
- Easy to find metrics are always less important
They are often just “vanity metrics” or “ego metrics.” They are often trivial and unrelated to business success.
Examples: Facebook likes, Instagram followers, retweets - Harder to find metrics are more important
They require tools and analysis. These correlate with business success.
Examples: change in rank and traffic to a high-converting service page, conversion rate per blog post, conversion rate per traffic source - The hardest to find numbers are the most important
They require research and math, but they are the most important numbers in your business
Examples: the percentage of leads that are qualified, customer satisfaction
I’m calling this Julian’s Law, after my friend and podcast co-host, Jeff Julian.
There is an inverse correlation between the visibility of a metric and its importance.
You can hear our conversation about this phenomenon on the Explicit Content Podcast.
Often, junior marketers aren’t aware of this inverse relationship and they chase the wrong outcomes. Other marketers know what’s important, but struggle to stay focused on the outcomes that matter. So let’s ask the big question: why do we keep getting distracted from the most important data?
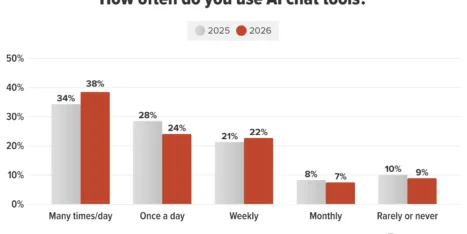
The least important, most visible metrics: Social stats
These metrics are public data, reported on by tools and platforms. These numbers are everywhere. You can see them for anyone.
- Follower count
- Likes
- Views
- Shares
The correlation with business success is weak. A brand could have a lot of Instagram followers but no revenue. Another brand could be great at getting business, but be terrible at getting followers.
I asked my friend Mark Schaefer to check me on my bias against social metrics. Here’s what he said…
 |
“I generally agree with the premise, with the exception of social sharing. The value of content that is not seen and shared is zero. The value of content marketing only comes through social sharing — the transmission — because organic sharing represents advocacy, which is better than any advertising you could buy.” -Mark Schaefer, consultant and Author of Known |
The more important, less visible metrics: Website analytics (GA4)
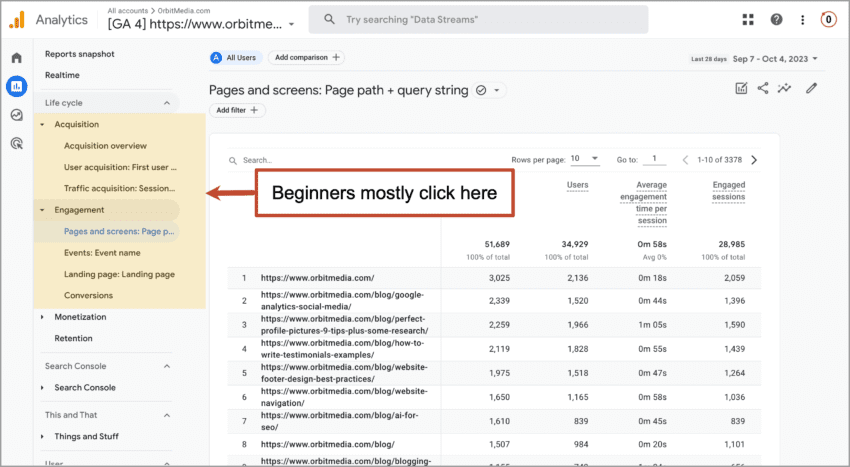
More important metrics aren’t visible to the public. Here are your website metrics. These are more important, but also don’t always connect to the button line. And within GA4, Julian’s Law still applies. The easiest to find Analytics data is the least important!
- Total traffic
- Aggregate bounce rate
- Aggregate conversion rate
These are easy to find with one click. But they aren’t very useful. Consider this: whenever you click on a report on the left in GA4, you’re looking at aggregate data. It is the broadest view, which holds the fewest insights.
The more you click to the right of the navigation menu, you’re looking at more specific, less aggregated data. This is where the gold is hidden. The more you use segments, filters, advanced filters, secondary dimensions, sorting and views, the more likely you are to find something useful.
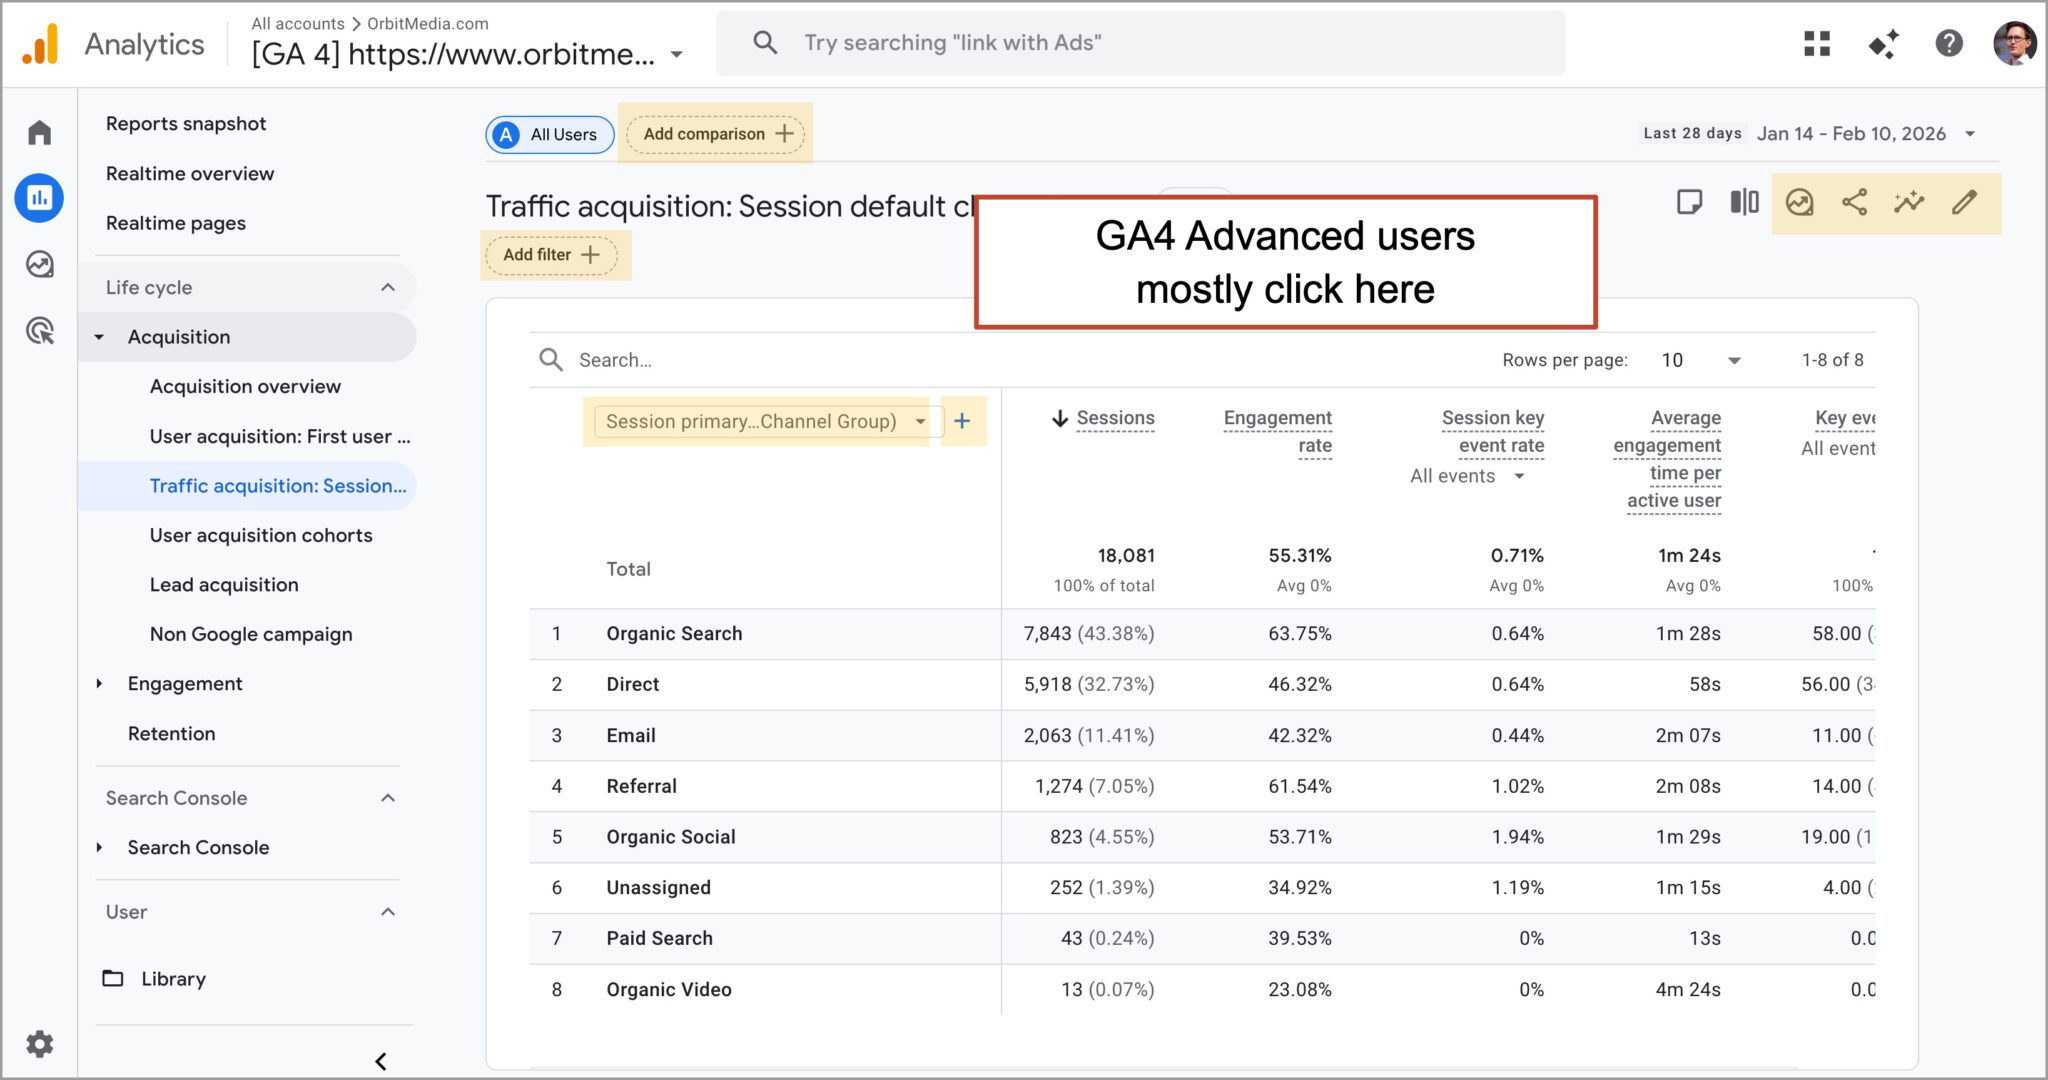
When you add more configurations to a report, you answer more specific questions and you find more actionable insights.
- Example: Which of our blog posts do mobile visitors spend the most time with?
Interesting question!
In some cases, you’ll need to pull the data out of Analytics and do calculations in a spreadsheet. These are called “calculated metrics” because they can’t be answered on a single report in GA4. Less visible, but more important!
- Example: Which of our blog posts converts the great percentage of visitors into newsletter subscribers?
Super interesting question! But you’ll need a spreadsheet to answer that one…
The most important, invisible metrics: Business analysis
Finally, the super important make-or-break-your-business numbers aren’t reported anywhere. You have to dig to find them. Look for clues in your CRM or in your accounting system. You might have to do outreach and surveys.
- Sales closing rate
- Net margin per service or product
- Customer satisfaction / Net Promoter Score
How do you get these numbers? Careful data collection and research. Crunch the numbers. Call the clients.
This bottom line connects back to the top line.
Happy customers make recommendations and write reviews.
Reaching out to clients to see if they are happy is also the best way to get testimonials. A little research at the bottom can power the content up at the top.
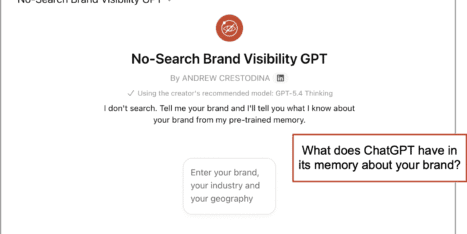
What about AI prompt tracking?
A new metric! But not an easy one to see. You’ll need software that tends to be expensive because it needs to prompt a lot to generate reports. And those prompts use a lot of tokens, which is how the LLMs charge those software companies.
The other problem with prompt tracking is that it’s not nearly as consistent as rank tracking. After all, traditional search algorithms are deterministic, but AI models are probabilistic.
The team at SparkToro got 600 volunteers to prompt 2,961 times, then they tracked how often brands appeared consistently in responses. The results? Less than 1% of the time, ChatGPT or Google’s AI gave the same list of brands in any two responses

That makes AI visibility one of those hard to measure but highly important metrics. You can’t easily track it, but you know that potential leads are there asking the AI for recommendations in your category.
What’s wrong with marketing? Blame the “Availability Heuristic”
We all have a cognitive bias called the availability heuristic. It means we overvalue information that is easy to access. When information is highly available (such as social media metrics) we tend to value it. This problem goes beyond marketing:
In news media:
Open news feed > see headline > “Man was eaten by shark” > conclude that sharks attacks are a big problem (they’re not)
In marketing:
Open Facebook > see engagement rates are low > conclude that you need to spend more time/money on Facebook (you don’t)
Combine Julian’s Law with the availability heuristic and you have the ingredients for disaster. Your brain is telling you to place higher importance on the least important data.
If the metric is easy to see, you’re probably putting too much importance on it. Don’t chase famous social accounts. It’s probably a waste to pay an influencer thousands of dollars to share your content. But if you do, dig deeper into your metrics and measure the impact.