I personally review the performance for every website we launch. We redesign around 40 websites per year. So I spend a lot of time in and out of GA4 accounts, measuring the impact of website redesign projects.
Every website is different. Different traffic sources, different content strategies, different goals and conversions. So every post-launch Analytics review is unique to that client.
But there are some reports I always run.
But first, a warning…
If you want to measure pre/post-launch results accurately, you should not change GA4 setup when you launch. You should fix Analytics issues long before you launch, right when you kick off the website redesign project. That way you’re accruing accurate data during the redesign process and the pre/post-launch Analytics data will be meaningful.
Similarly, launch day is a terrible day to change your cookie consent settings. If you install a CMP (consent management platform) at the time of launch, you are changing how much data is tracked. Change that on launch day and you can’t accurately measure website redesign ROI.
The smart web development company advises their client to do two things related to GA4 and website launches:
- Always check (and repair) GA4 issues when the website project kicks off.
- Never change cookie consent settings on launch day. Do it months before (or months after) the launch.
Nothing should change on launch day but the website.
Make sense? We want a nice, accurate pre/post look at the data. Now we’re ready to jump into the reports and measure the impact of the new website.
1. Is search traffic up or down?
Most traffic sources aren’t affected by website redesigns. Direct traffic doesn’t go up or down just because you redesigned. Paid, social and email traffic don’t change.
But search traffic is almost always impacted in a website redesign, for better or for worse.
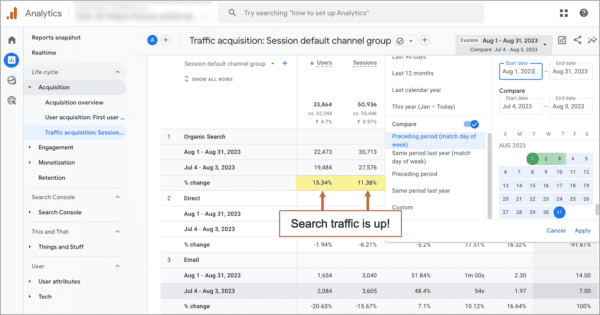
It’s easy to check. No need for fancy custom reports or explorations. To see if search traffic is up or down, just go to the Acquisition > Traffic Acquisition report and set the date range to start a few days after launch and toggle the “Compare” switch to “Preceding Period (match day of week).”
This screenshot shows a pre/post-launch comparison for a site that launched on August 1st.
 Caution: Most websites are affected by seasonal changes in traffic. So compare traffic to “Same period last year” to exclude seasonality from the data. If you didn’t have GA4 set up a year ago, this won’t work.
If search traffic is down and the reason isn’t seasonality, it’s likely because of the redesign. Here are the five main reasons why redesigned websites see a drop in search traffic:
- URLs that attracted search traffic were removed
- URLs that attracted search traffic were changed (even if they were redirected)
- Content became less keyphrase-focused or less detailed
- Technical SEO issues appeared (missing schema, longer load times, etc.)
- You changed your domain name and you didn’t follow these steps.
If search traffic is down, don’t panic. You don’t yet know what kind of traffic declined. It’s possible that you saw a drop in low-intent visitors (people reading old, irrelevant blog posts) but an increase in high-intent visitors (people landing on your key service pages).
So the next steps to check changes in search traffic to specific URLs. That top-line report was just a quick check. To see what’s really happening, we’ll make a quick GA4 Exploration. First, navigate to the “Explore” section from the far left menu (it’s the blue icon with the arrow pointing up) and click on Free form.
- At the top of the “Variables” column on the left, name the report “Search Traffic Landing Pages.”
- Set the date rate to show the month post-launch and compare to previous period.
Now we’ll add the dimensions and metrics that we’ll use to build the report. We’ll need two dimensions: landing pages and session medium.
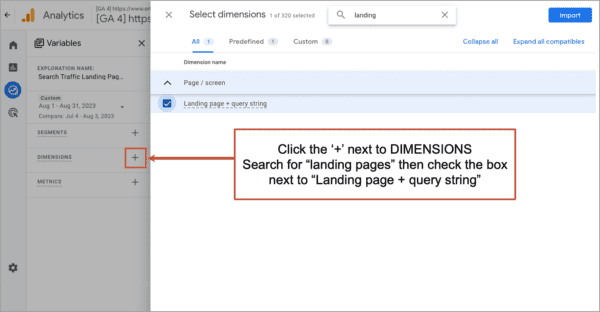
- Click the plus sign ‘+’ next to DIMENSIONS
- Search for “landing pages”and then check the box next to “Landing page + query string”
- Click Import
Next add our metrics. Usually, we’d add several, but here we’ll keep it simple and just use one.
- Click the plus sign ‘+’ next to METRICS
- Search for “sessions” and then check the box next to “Sessions”
- Click Import
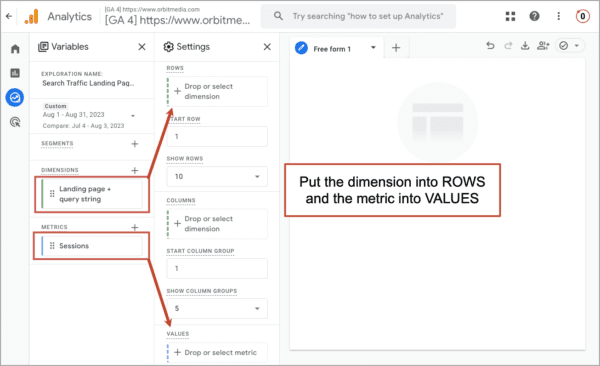
Next we’ll build the report using those dimensions and metrics. We’ll do this in the Settings column.
- Select or drag in the two dimensions into ROWS boxes
- Select or drag in the metrics into the VALUES boxes
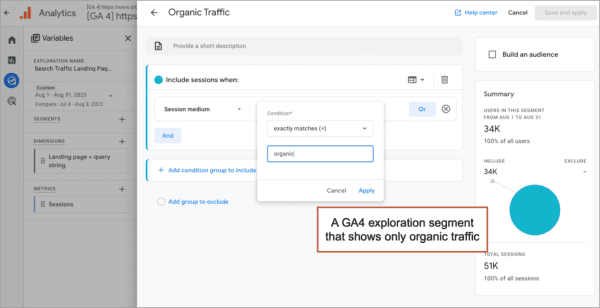
The exploration is now showing you the pre/post-launch traffic to landing pages. Nice! But we don’t want to see all the traffic. We just want to see organic traffic. So for this we’ll make a segment.
- Click the plus sign ‘+’ next to SEGMENTS and then click the “Sessions segments” button
- Name the filter “Organic Traffic”
- Click the “Add new conditions” dropdown
- Search for “Medium” then select “Session medium”
- Click the ‘+ Add filter’ button
- From the dropdown list, select “exactly matches (=)” and in the box below, select “organic” and click “save”
- In the top right, click “Save and apply”
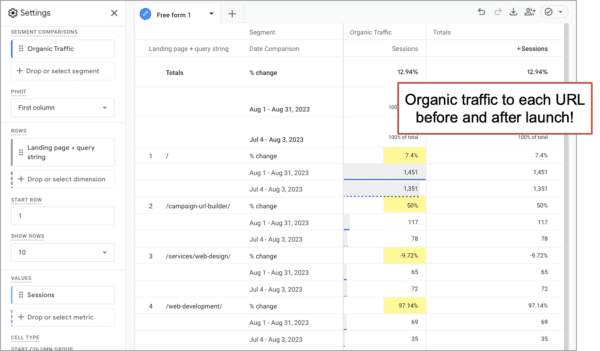
 There it is. The traffic from search engines to each of your pages before and after the website launch. You can clean up the report by right clicking on rows that are useless (such as “not set”) and pages that aren’t as important to lead generation (such as blog posts). Focus on the homepage and those key service pages.
Here’s what your new exploration will look like.
 Of course, if your web development partner changed all of your URLs during the website redesign process, measurement is much harder. But you may still be able to piece together the story with some manual effort (export to CSV, map together the old and new URLs, then compare traffic).
Seeing search traffic impact per URL is much more useful than seeing overall search traffic changes. With this data, you can start looking at specific pages and asking what changed during the redesign process. For any page where traffic dropped, ask these questions:
Questions and Actions
If traffic to any URLs went down, ask yourself:
- Did the target keyphrase change?
Consider adjusting the keyword targeting, unless the new target phrases are attracting much more qualified visitors. - Did the title tag or headers change?
Consider changing them back or improving their keyphrase-focus. - Is the new body text less keyphrase focused? Shorter?
If the new pages do a worse job of indicating relevance than the old pages, consider a round of SEO copy edits. Add back more of the semantically related phrases. If you need help or ideas, you can try this AI method for SEO. Works like charm.
2. Do the new pages have higher engagement rates?
For the next measurement, we can stick with the reports. No need for explorations this time. Also, no concerns about seasonality. Seasonality affects how much traffic, but shouldn’t affect how engaged visitors are.
Here’s how to check changes to the engagement rate of your pages, before and after a website redesign:
- Go to the Engagement > Pages and screens report
- Set the date range to start a few days after launch. Toggle the “Compare” switch to “Preceding Period (match day of week)”
- Change the primary dimension by clicking the dropdown above the first column (which probably says “Page title”). Change it to “Page path and screen class (which is the GA4 code word for URL)
That’s it. Scroll over to the right and you’ll see the engagement rate metric, before and after launch, for every URL.
If you’d like to see just your high-intent service pages by excluding the blog posts, you can click “Add filter +” and create a filter to remove all the URLs that contain “blog” or whatever word is in the name of the directory with your content program (Page Location does not contain blog).
Unfortunately, if your content marketing is not all in a common directory, this isn’t possible. Maybe ask your web developers why they did that…
All set? Here is the report and the settings for the filter should look like.
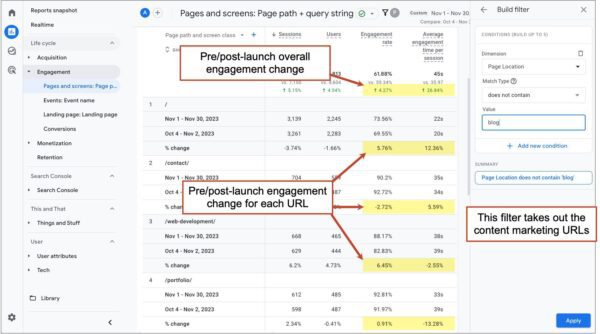 Here you can see I’ve customized the report to show Engagement rate and Average engagement time as two of the first columns. This makes it a bit easier to analyze. If you like that, click on the pencil in the top right and then clicking “Metrics” to add and reorder the metrics. If you like this, do it first, before you make your filter. Customizing reports removes all filters.
The report shows that engagement rates are up a smidge for our homepage and web development page and slightly down for the contact page.
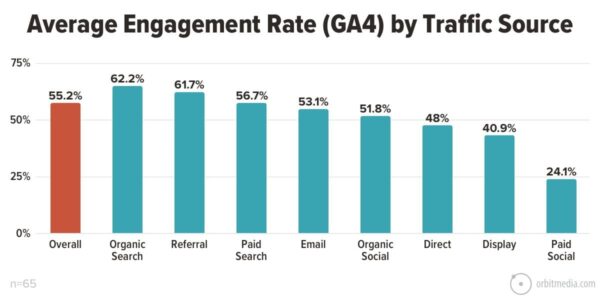
Overall, the engagement rates are very high. What’s high? The average engagement rate on websites is 55% but this varies by traffic source.
 Want to see how engagement rates vary for desktop and mobile visitors? You can see this in an Exploration. Put the “Page path” dimension in the ROWS box, put the “Engagement rate” metric in the VALUES box, and put the “Device category” dimension in the COLUMNS box.
The experience for mobile and desktop visitors is usually very different, so of course, engagement rates will also be different.
Questions and Actions
If the new pages have lower engagement rates, ask yourself a few questions:
- Is the new page intended to be highly engaging? Or is it’s job to quickly pass the visitor through to a deeper page?
If the page is basically a menu of other pages, a low average engagement time may be perfectly fine. - Did the above-the-fold content change?
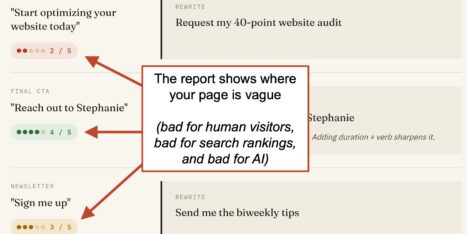
This can reduce engagement, especially if the text in the H1 header is vague. Make the headers more specific and descriptive. Their job is to tell the visitor that they’re in the right place. - Is the page a lot shorter now?
Shorter pages have lower engagement rates. This should surprise no one. Add depth and detail. Then there’s more to engage with. - Did overall traffic go up?
If the page is now attracting less qualified visitors, engagement rates will drop. If you don’t mind trading lower engagement for more brand awareness, don’t worry about it.
3. How are visitors using the navigation menus?
When menus change, the use of those menus will change. And it’s very common for website redesign projects to lead to new menu styles.
The mobile menus, mega drop downs, CTAs and navigation labels may all be different as the new site may better align with website navigation best practices.
To see how your visitors are using your new menu system, you’ll need to create a Path Exploration. So navigate to the “Explore” section from the far left menu (it’s the blue icon with the arrow pointing up) and click on Path exploration.
- Click “Start over” in the top right.
- Click in the STARTING POINT box and select “Page path and screen class” as your node.
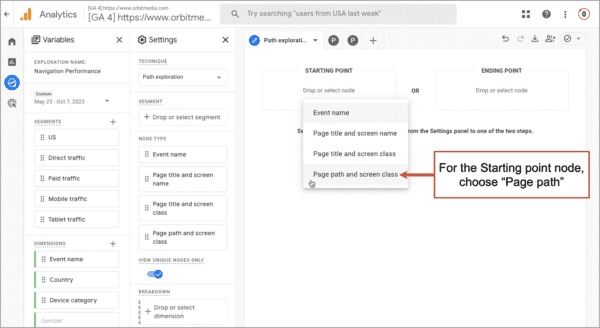
- Choose the homepage (or any page) from the “Select starting point” menu that slides in from the right.
The report will show you the number of people who went from the starting point page to the subsequent pages. This is the performance of your navigation, which includes the performance of the calls to action. To measure the clickthrough rates on your call to action, divide the visits to that page by the visits to the homepage. That’s your CTA’s CTR.
This short video shows how to create that quick Path Exploration. This is one part of a more detailed approach to user flow analysis using GA4.
Questions and Actions
Here are examples of the kinds of analysis you can do based on that GA4 exploration:
- Are people skipping over pages with important messages or supportive evidence?
If so, move those messages into the more popular pages in the flow. This is a very common issue with dropdown menus. Designers and copywriters work hard on the top level page, but the dropdown encourages visitors to hop over it to deeper interior pages. - Are little things getting clicked a lot?
If so, consider making those items more prominent in the navigation to help visitors find them quickly - Are big things getting skipped?
If so, consider re-labelling them to increase clicks or giving up and accepting that it doesn’t align with visitors’ information needs. - Do calls to action have low clickthrough rates?
If so, consider changing the CTA to make it more specific, to reduce the psychological commitment, to make it seem easier, faster or more valuable. These are just some of our button design best practices. And if it’s not the button, it’s probably the copywriting. Answer more questions or add more supportive evidence.
4. Are leads and subscribers up or down?
The key metric! Desired actions for visitors (forms submissions/leads, newsletter signups, file downloads, etc.) are called “conversions” by marketers and called “key events” within Analytics.
But it’s often difficult to measure because the GA4 setup may have changed. The new website may have different definitions of success and new or different goals. If so, those can’t be setup until the new site launches.
For now, we’ll assume that the conversion events didn’t change during the redesign process and that everything is tracking accurately.
Here’s how to check changes to the conversion rate of your website, before and after a website redesign:
- Go to the Engagement > Events report (or the Engagement > Conversions report if it is available)
- Set the date range to start a few days after launch. Toggle the “Compare” switch to “Preceding Period (match day of week)”
That’s it. Here’s what it may look like for you.

This is a good report to start with because it shows the change for each type of conversion. The website’s overall key rate may be down, but the more important conversions, such as leads, may be up. In the screenshot above, you can see that newsletter subscribers is up 9% (good!) but the contact form submissions are up 15% (fantastic).
The insights are always one level down from the top-line number. Never react to aggregate data. Look deeper.
A good way to look deeper is to check key events rates per traffic source. Not all of these numbers are affected by a website redesign, but it’s critically important for marketing strategy in general. So while we’re here, let’s take a look.
Here’s how to see which traffic sources are attracting visitors who take action.
- Go to the Acquisition > Traffic Acquisition report
- Click the pencil in the top right to customize the report.
- Click Metrics. Move “Session key event rate” and “Key events” up toward the top of the list
- Click Apply, Save (Save changes to current report) and click “<– Back” to return to the report
Now you’re looking at the conversion rates for each source of traffic. If you’d like to see the conversion rate for a specific goal, click the “All events” dropdown at the top of the “Session key event rate” and “Key events” columns and pick the conversion of your choice. Here I’ve chosen leads:
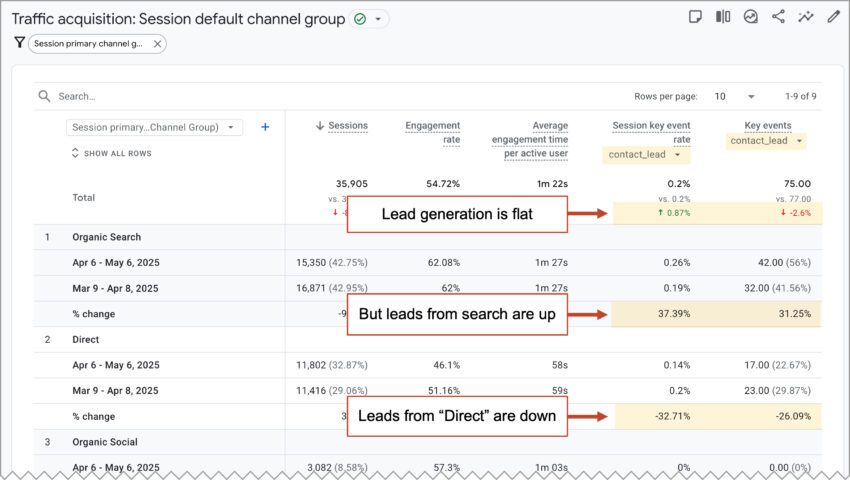
Sometimes the insights jump right out of this report. It may guide resource and allocations, staffing decisions, partner relationships, influencer collaborations and PR efforts. It’s a valuable report.
Questions and Actions
Here are conversion-related questions you GA4 data is asking you:
- Is the key event rate for one specific type of conversion down?
If so, look closely at Analytics to understand the path for those visitors. Where do they enter? Where do they go next? From where do they exit? Now go to your website and emulate that experience. Did you find any clues? Maybe some friction, confusion or missed opportunities? - Are conversions from a specific source higher or lower after the relaunch?
Consider the source. If it’s paid, look closely at the ads. If it’s social, spend some time in those streams. If it’s search, look at the keyword data. The source is your clue into visitor expectations. When expectations are met, conversion rates rise. - Are overall key event rates (and search traffic) up?
The redesign is showing immediate ROI. The new site is better cheese on a better mousetrap. Both brand awareness and demand are on the rise. You’re only regret may be not redesigning sooner!
Bonus tip from GA4 pro, Brie Anderson!
 |
Brie Anderson, Beast AnalyticsAre micro conversions being impacted? If you find that your key event rates are down, consider drilling down a bit further. In your Pages and Screens report find the “Events” metric, click the drop down labeled “all events,” and select the micro conversion event. Look for any major drops in these micro conversions – this may be an indicator of a breakdown earlier in the funnel. |
There you have it. With these reports, you’re set up to both measure the ROI of your website project and to start the process of website optimization. Digital ink is never dry!
How soon after a website redesign should you check Analytics?
I review Analytics with every client one month after launch day. That’s generally enough time to start seeing the impact.
But really, it’s a matter of data, not a matter of time. A high traffic website may have enough visitors flowing through to get insights in weeks or even days. Data is a function of time. The more user interactions that are recorded in GA4, the more meaningful the data will be.
Of course, you can check it much sooner to make sure GA4 is working. You can also use Analytics to look for website bugs, which is something you can do right away, just days after a redesign.
Bonus! Other types of GA4 analysis do to after a website launch…
Virtually every interaction taken by visitors can be measured in GA4. Here are some of the best types of analysis to try. Do them all and you’ll have leveled up your GA4 skills!
- Are visitors using your site search tool post-launch?
If the visual prominence of the search tool changed, the use of it will likely change.
https://www.orbitmedia.com/blog/how-to-set-up-site-search-google-analytics/ - Is the content marketing program performing post-launch?
If the design of the blog templates changed or the CTAs to subscribe changed, the performance of the content program will likely change.
https://www.orbitmedia.com/blog/content-marketing-audit/ - Are visitors watching your videos? How do videos impact site performance?
If the new site has embedded videos (especially if they are YouTube videos) the performance of those videos is measurable in GA4. It takes just a few minutes and the insights are often quite valuable.
https://www.orbitmedia.com/blog/tracking-video-views-google-analytics-tag-manager/
Anything else we can help you measure in GA4? Please let us know.