Once upon a time, Google Analytics had a ton of reports, each with its own insights. That era ended. Now we all use GA4, which has fewer, more customizable reports. Got a question? Looking for insights? Go customize a GA4 report.
But reports are just the beginning. The real fun is the Explorations. Originally called the Analysis Hub, GA4 Explorations are where you can build much more useful reports, including many things that are impossible in the GA4 report section.
We’ll build GA4 explorations for three specific insights here in one article:
- Find the clickthrough rates on your calls to action (and your entire menu)
- See if your mobile visitors ever convert (especially from paid sources)
- Discover which of your articles performs the best (and in which channels)
This video shows all three methods.
By the time you reach the bottom of this post, you’ll know how to build GA4 explorations and explore your own data. You’ll be ready to create and share your own explorations.
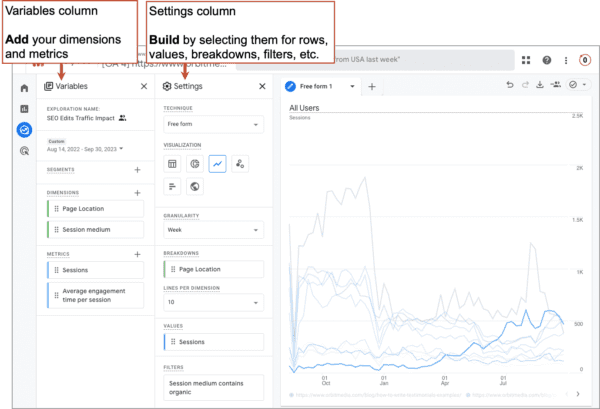
But first, let’s see the landscape. Here is the layout for a typical GA4 Free Form exploration, showing the variables and settings columns. In these instructions, when we refer to variables and settings, we’re talking about what goes in each of these two columns.
Chefs gather their ingredients before cooking.
Artists add paints to their palette.
GA4 analysts add dimensions and metrics. They do this in the variables column, so they can select them in the settings column to build their exploration.
Also the variables column is where you name your exploration and choose the date range. The settings column lets you select the technique (free form, path exploration, funnel exploitation) and the type of visualization.
Check paid traffic conversion rates for desktop vs. mobile
Do visitors on mobile and desktop convert at different rates?
Should you turn off ads for mobile visitors?
I don’t know a lot about digital ads. But I know how to measure conversion rates using GA4 explorations. And I can easily see conversion rates from paid traffic sources.
A quick GA4 exploration shows how much traffic came from paid sources and the rate at which they convert (become a lead or buy a product). And with a few more clicks, you can see the difference across device categories, desktop and mobile.
Here’s what it looks like.
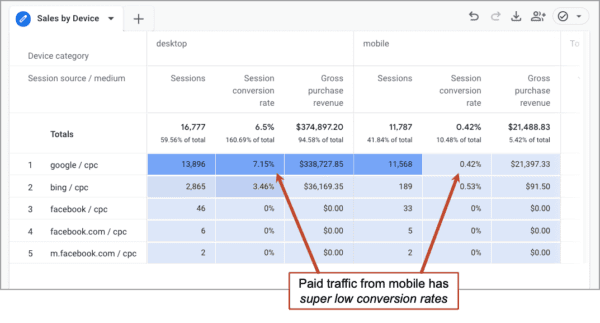
In the exploration above, you can see that paid traffic is roughly evenly split between desktop and mobile, but desktop visitors are 17x more likely to buy than visitors on mobile devices.
That means that the Google Ads spend is very inefficient, but easy to fix. Turning off ads for mobile devices will cut the ad spend in half, with only a small drop in sales.
I’ve shown this to many clients, two of whom immediately turned off mobile ads. One saved $70,000 per year. The other saved $8,000 per year.
So if you are buying traffic, try an exploration that shows conversion rates by device category. Start by going to the Explorations section and click on Blank to create a new exploration. Then use the following variables and settings.
Variables:
First we need to add our dimensions and metrics. Do this by clicking the little plus signs. Then searching for them by name and checking the boxes for each one.
- DIMENSIONS: “Device category” and “Session source / medium”
- METRICS: “Sessions” “Session conversion rate” and “Conversions” or “Gross purchase revenue” for ecommerce
Also in this column, you can give it a name such as “Conversions from Paid by Device”
Settings:
Drop or select the dimensions and metrics in each of the following settings boxes.
- ROWS: “Session source / medium”
- COLUMNS: “Device category”
- VALUES: “Sessions” “Session conversion rate” and “Conversions”or “Gross purchase revenue” for ecommerce
- FILTER: “Session source / medium” contains “cpc”
Now you’re looking at the paid traffic performance across device types, just like the screenshot above. If you want to remove any rows such as (not set), or columns such as tablet, just right click on it and select “Exclude selection” from the menu.
Once it’s nice and tidy, take a screenshot and send it to whomever handles your digital advertising. Or better yet, share the actual exploration
Share your fun new exploration
Here’s how to share a GA4 exploration so other people can see it when they log into this Google Analytics property.
- Make sure your exploration has a meaningful name
- From the main explorations page click the three dots to the far right of the exploration
- Click “Share” from the menu, then you’ll see a popup window reminding you that the share version will be read-only. Click share.
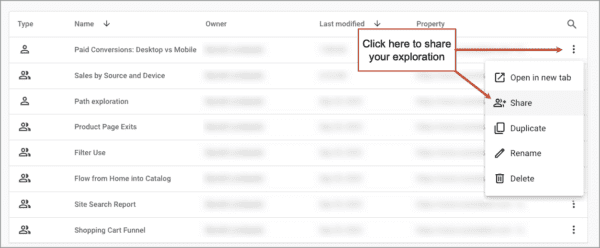
The little icon on the left “Type” column will show that it’s shared. Now, anyone who logs into this GA4 property from any login will be able to see that exploration. It will be in read-only mode so they can’t change it, but if they do want to play with it, they can duplicate it and then make changes on the new version.
Although I like to start with a clean slate “Blank” exploration, my good friend and Analytics pro Kyle Akerman suggests using the Free Form exploration template.
 |
Kyle Akerman, Google Analytics Consultant“Building an Exploration table can be confusing when you start out. I recommend clicking the “Free Form” report versus the “Blank” report. The Free Form template comes pre-populated with Dimensions and Metrics, so you can see how the table is built. Then just substitute in your desired Dimensions and Metrics. It’s much easier than starting with a Blank report page.” |
Find the clickthrough rates of your calls to action
What percentage of visitors click on your CTA?
How is your navigation performing?
Marketers should really know the clickthrough rates of their calls to action. It’s a very important number. All else being equal, more clicks on your call to action is more demand. It is that simple.
If you don’t know yours, here are steps to find the CTR of your CTAs in GA4 PDQ. And for more insights, here’s our detailed process for user flow analysis using GA4.
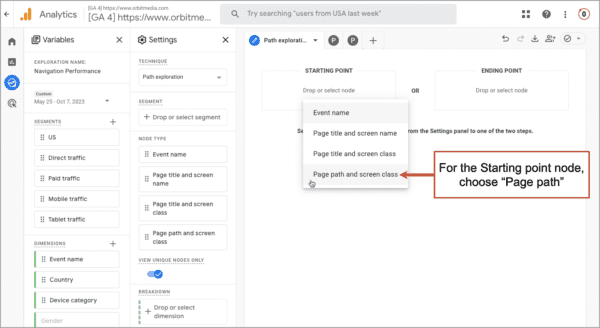
- Click “Start over” in the top right
- Click in the STARTING POINT box and select “Page path and screen class” (or drag it in from the Settings column)

- Choose the homepage (or any page) from the “Select starting point” menu that slides in from the right.
The report will show you the number of people who went from the starting point page to the page behind the call to action (often it’s the contact page). Divide the second number by the first and you have the clickthrough rate of the call to action.
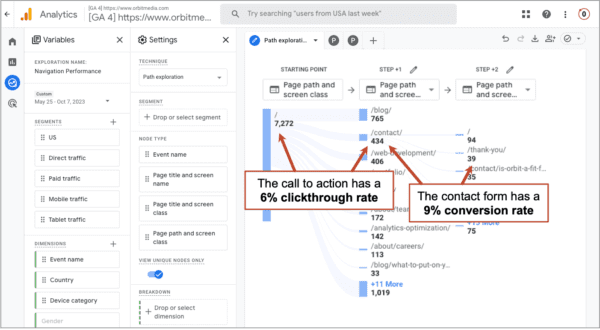
Click on the contact page and you can see the percentage of visitors who made it all the way to the thank you page. Keep in mind, this only shows those who started at the homepage, so it’s undercounting. A more accurate measurement is made by making the thank you page the ending point and going backwards.
Also important: if there are several CTAs on the page that go to the same page, this report doesn’t show which they clicked. It just shows visitors flowing from page to page. The most beautiful way to see clicks is with a heat mapping tool such as Hotjar.
You can also use segments to see performance from various channels and device categories. And if something irrelevant skews your data (i.e. current customers clicking to login) you can exclude it by right clicking on that node.
This exploration actually shows the performance of your entire menu system. navigation. It may give you many ideas. What’s the top path? What little things get clicked a lot? What never gets clicked?
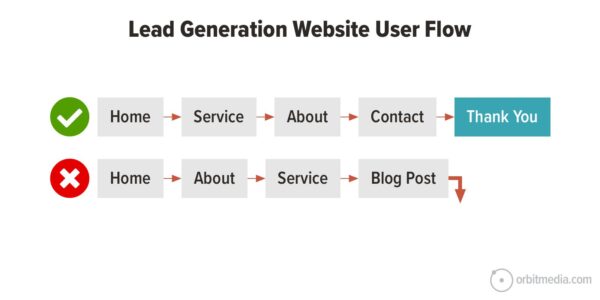
Once you see the user flow, you can optimize, gently guiding a great percentage of your visitors to the thank you page. Make sure desired actions are clearly visible, remove distractions, leverage biases and watch your verbs.
Discover performance across channels for any article
Did that article do better in search or social media?
Visitors from which traffic source were most engaged?
Big effort goes into creating an article.
Big effort goes into promoting that article.
But often, only a small effort goes into measurement and performance analysis.
In the GA4 reports, results for the article are mixed into everything else. It’s in the “Pages and screens” report but it’s often hard to find and the metrics are all aggregated for every source and medium. Not ideal.
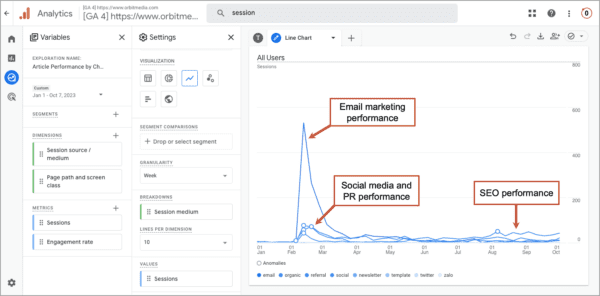
Here’s how to use a GA4 Exploration to see the performance for just one article, broken out by source and medium, over time. We’ll check an article a few months after it was published so we can see the search performance, which unlike social and email, requires a longer date range for performance measurement.
To create that exploration for an article of your own, from the explorations menu, choose “Blank” to start from scratch. Then use the following variables and settings.
Variables:
Click the plus signs next to Dimensions and Metrics, then search for and add the following:
- DIMENSIONS: “Page path and screen class,” “Session medium” and “Session source / medium”
- METRICS: “Sessions” and “Engagement rate”
Settings:
Drop or select your dimensions and metrics in each of the following settings boxes.
- VISUALIZATION: Click the Line chart button
- GRANULARITY: Week
- BREAKDOWN: “Session source / medium”
- VALUES: “Sessions”
- FILTERS: “Page path and screen class contains [the URL of the page your analyzing]”
Once done, you’ll be looking at a line chart showing traffic to the article, with a different color line for each traffic medium, as in the screenshot above. If you see anything irrelevant, just right click it and select “Exclude” to create a filter that removes it.
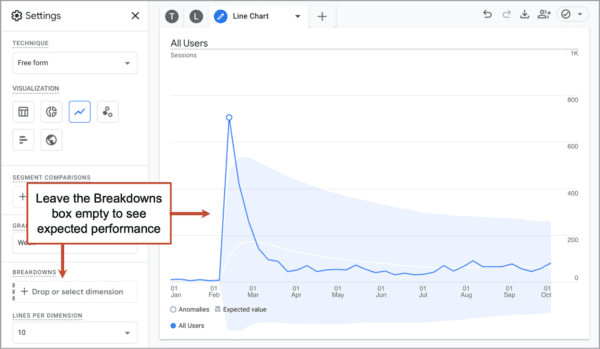
This exploration shows the relative strengths of your promotion channels and whether or not the article is getting any traffic from search. Compare this to other articles by changing the filter. Or just clear out the breakdowns box and GA4 will show the expected values for traffic across all channels. It’s a benchmark range.
To see the engagement per channel, and not just the traffic, create another exploration (either as a new exploration or just as a new tab in this exploration) using the table visualization. Here we’ll add in desktop vs. mobile to look for more insights.
Variables:
Click the plus signs next to Dimensions and Metrics, then search for and add the following:
- DIMENSIONS: “Page path and screen class” “Session source / medium” and “Device category”
- METRICS: “Sessions” and “Engagement rate”
Settings:
Drop or select your dimensions and metrics in each of the following settings boxes.
- VISUALIZATION: Click the table button
- ROWS: “Sessions source / medium”
- COLUMNS: “Device category”
- VALUES: “Sessions” and “Engagement rate”
- FILTERS: ““Page path and screen class contains [the URL of the page your analyzing]”
The exploration shows how different sources of traffic on different devices drive traffic and engagement in different ways:
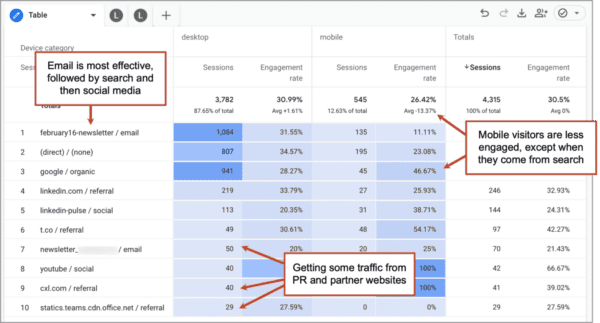
It’s always interesting to see how content performs differently across traffic sources. In the example above, you can see how few people click on the emails from mobile devices. We should test our emails on mobile devices. And notice the traffic from partners. We should reach out, thank them and look for ways to collaborate.
Ready to explore on your own?
We hope that these specific use cases were useful, but beyond these exploration examples, we hope that the approach gives you many more ideas for GA4 reporting and analysis.
If you’d like to go deeper into more measurement techniques, here we’ll share other how-to articles for GA4 explorations.
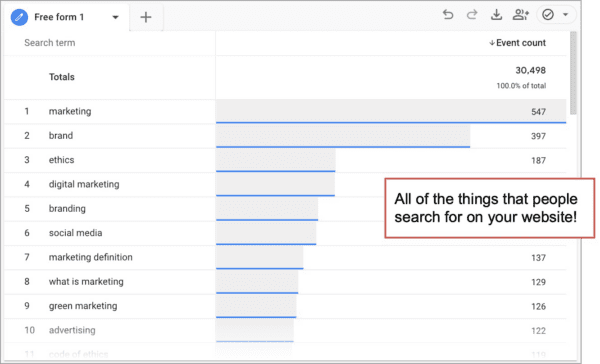
- How are people using your search tool?
Here’s the step-by-step process for doing site search analysis. The final exploration will look like this:

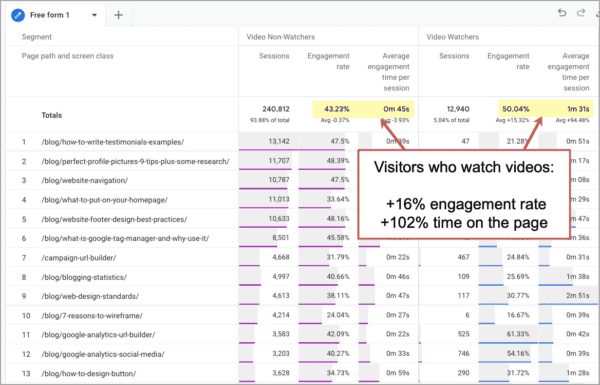
- How to track video views in GA4
In some ways, this is easier in GA4 than it was in Universal Analytics. Here’s how to create an exploration that shows how embedded videos impact website engagement. The exploration will look like this:

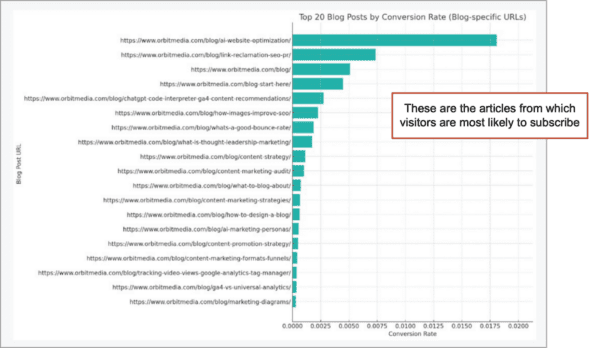
- How to use AI to help analyze your GA4 data
OK, this one isn’t really about explorations, but it’s too fun to leave out. It’s actually the recording from our webinar about combining AI and GA4. Here’s an example of a chart generated by AI after analyzing your GA4 data…

Time to explore your own data!