Knowledge is power. Data drives decisions, but some data is hard to get to. Some of the most interesting data is impossible to get to. Ever wish you could peek at your competitors’ Analytics?
You could ask nicely, but they’re not likely to share access. Not gonna happen. But actually a lot of the data is public. And there are competitive analysis tools that take the public data and create reports. Some of these reports mirror the reports in Analytics.
Here are five free tools, available to anyone. Just plug in the web address of your competitor. Some of these tools are more accurate than others. We’ll judge their accuracy by comparing their numbers to the actual Analytics of orbitmedia.com.
Here they are in the order of the corresponding reports in Analytics…
Audience > Visits
The first report is overall traffic levels and it’s one of the least accurate. Unfortunately, the tools that estimate traffic levels are either not free or not very accurate.
Alexa and Compete don’t include traffic levels in their free versions. So here’s a report from trafficestimate.com (edit: now defunct). Keep in mind that estimates may be way off, especially for smaller, lower traffic websites.

Accuracy Check: Terrible. I recommend using Similar Web instead!
This particular example is way off. The actual site had 31,000 visits during this time frame. The estimate is 20x higher than the actual. Ouch.
Audience > Demographics
The next intelligence report is demographics. Here Alexa does include the data in the free version. Where Google Analytics shows gender and age, Alexa shows Gender, Education, and Browsing Location.
Keep in mind, these are just estimates. This data comes from users of the Alexa Toolbar, which is used by less than 1% of internet users.

Accuracy Check: Good
The gender data aligns almost exactly with the Demographics report in Google Analytics.
Audience > Geo
Where are their visitors coming from? The same insights from the “Geo” report in Analytics is available in Alexa, but only on the country level.
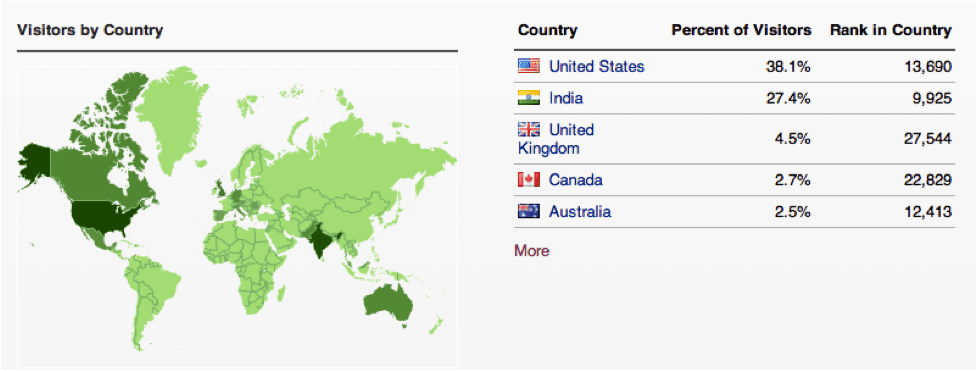
Accuracy Check: Fair
Google Analytics data shows the same countries in the same order, but the percentages are off. GA shows 55% US traffic and only 9% India. There must be lots of Alexa Toolbar users in India…
Acquisition > All Traffic
In Analytics, the “All Traffic” reports show the percentages of several traffic sources. There’s no way to see their direct or referral traffic, one of the Alexa reports is an estimate of the percentage of traffic that comes from search engines.
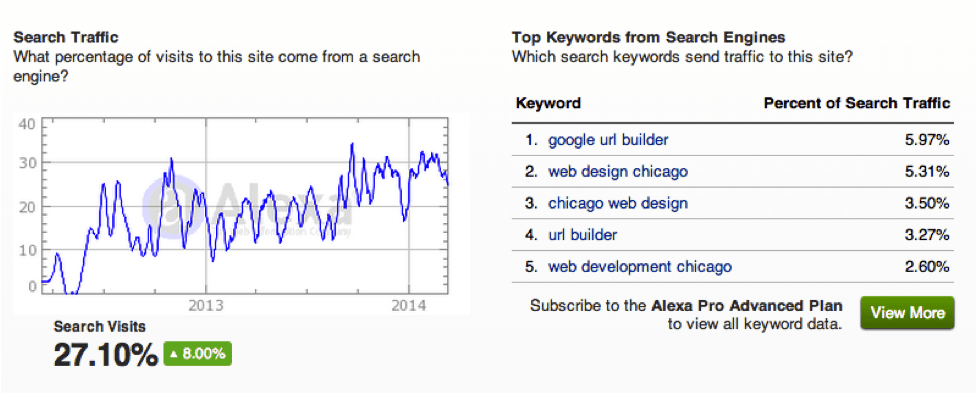
Accuracy Check: Poor
Alexa is underreporting our search traffic percentage by half. Google Analytics shows 59% of traffic coming from search.
Acquisition > Adwords
Are they using pay-per-click advertising? What phrases are they targeting? How much are they spending? Rather than search for every imaginable phrase, enter their address into iSpionage. It shows you the budget, clicks and keywords for any site.
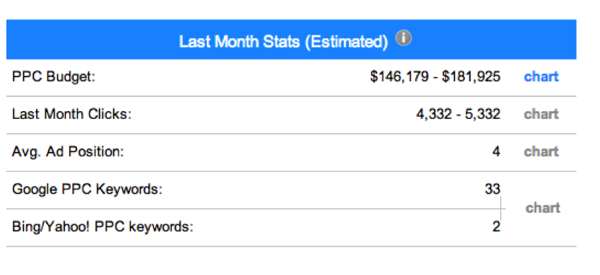
Accuracy Check: Fair
Accurate budget estimates for every AdWords advertiser are extremely difficult to derive. iSpionage does a good job with larger AdWords spenders since there is more data upon which to base the estimates.
Acquisition > Search Engine Optimization > Queries
One of the most useful reports in Analytics is the “Queries” report, since it shows what phrases your site is ranking for. You can use this to find new phrases and optimize your blog. Seeing this data for your competitors can give you insights into what’s working for them, and what might work for you.
Again, iSpionage makes this public data easy to see. Enter a competitor’s address and see the phrase, rank and search volume for the top ten phrases. Subscribe to the pro version to see the complete list. This is extremely valuable data.
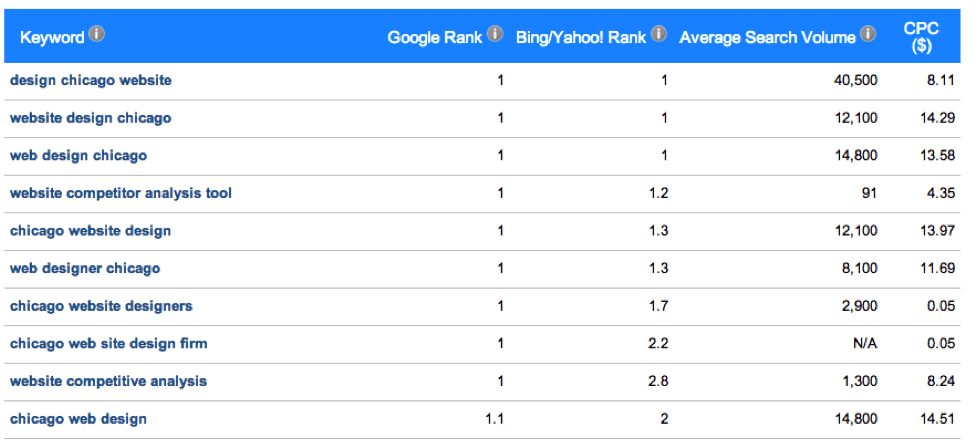
Accuracy Check: Excellent
This data may be more accurate than Analytics, or at least easier to read. Analytics shows “average position” which may combine the position of several related rankings. This makes the iSpionage report more meaningful and practical.
Behavior > Overview
Let’s go back to Alexa to see the basic engagement data. Three numbers are provided that correspond with reports in the Behavior overview: bounce rate, average pages per visit, and time on site.

Accuracy Check: Excellent
The bounce rate here differs from the Google Analytics data by only a few percentage points. Time on Site is off by only 12 seconds. Pageviews per visit are almost exact.
Behavior > Site Speed
Page load time is also public data. One of the best known tools for seeing the speed of any site (including yours) is the Pingdom Website Speed Test.
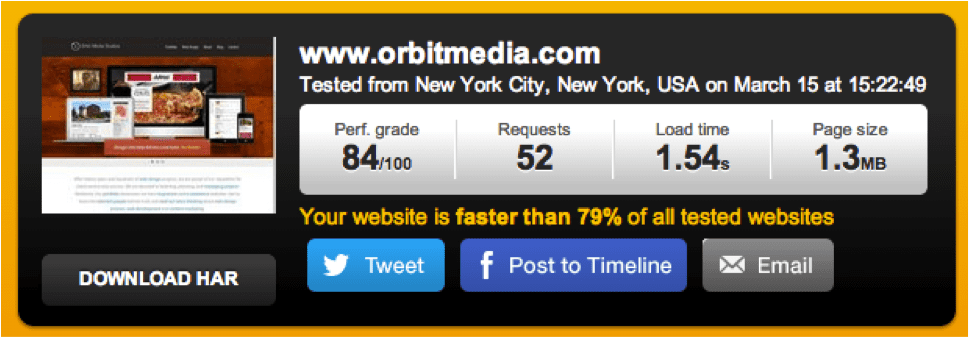
Accuracy Check: Excellent
As with the iSpionage ranking report, this report is actually better than the report in Google Analytics. It shows you the load time for a specific page, rather than the average for the entire site. Analytics data includes the load time for third-party tools, such as social media widgets. This inflates the numbers, making the report less meaningful.
Bonus Report!
Search Console > Search Traffic > Links to Your Site > All Linked Pages
There’s a very important report in Google Search Console for anyone who relies on search engine traffic. It shows which of the pages have attracted the most mentions on other websites. It shows which pages have incoming links and how many.
To see this data for competitor sites, enter the address into Link Explorer, then click on “Top Pages.” The free version shows the top five pages. The paid version shows them all.
These pages have the most ranking potential, but they are also the pages (and topics) that have won the most respect from other sites. The home page is always on top, but the next pages on the list may be a surprise…
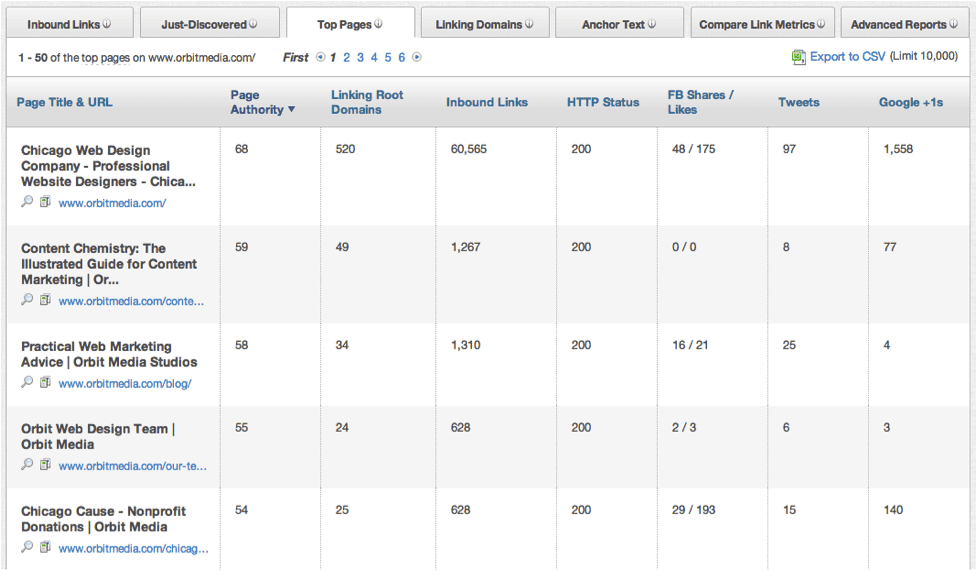
For the Orbit site, this report shows two of our major marketing initiatives: our book, Content Chemistry, and our annual philanthropic program, Chicago Cause.
Accuracy Check: Good
Although Link Explorer is a huge database, Google Webmaster tools shows about twice as many links. But the relative link popularity between pages is roughly the same in OSE and Search Console. Good enough for me!
Now you’ve got the data, make the most of it…
When tools are free and fast to access, sometimes it’s fun just to take a look. But the data is only valuable if you use it. The insights you discover will depend on the report and the data within. Here are some likely next steps:
-
Audience and Behavior Reports:
My site is X, my competitor’s site is X+1. How can I learn from them?
My competitor’s site is X. My site is X+1. Keep up the good work.
-
Acquisition Reports:
My competitors get traffic from X. Would X be a good traffic source for me?
Keep in mind that the data may not be accurate, but then again, Analytics isn’t always accurate either. Competitive Intelligence is all about benchmarks, insights, and new ideas. Like any good spy, stay skeptical, look for connections, and keep an open mind!


