Marketers talk a lot about generative AI for copy and content.
But this misses one of the most powerful applications: AI for analysis and insights.
If you’re using OpenAI’s ChatGPT Plus, then you have access to Advanced Data Analysis (formerly called Code Interpreter), which is the feature that lets you upload CSV files and ask it to draw charts. So you can upload your marketing analytics data from any source and ask it for visualizations and insights.
This is fast and powerful analysis.
Bad at Excel? Never used Looker Studio? Not a data scientist?
No worries. Just ask the AI to visualize data for you. In under 10 minutes, you’ll do things that used to take a full day or help from a high-skilled expert. All you need is marketing data. The more the better.
Here are six charts and the prompts we used to create each. Try them. If you get stuck, just ask AI for help. If you’re an Orbit client, you can ask me.
Caution! Check with legal before uploading data to an AI. If you’re an agency, ask your client before uploading their data. There is no way to delete any of the files after they’ve been uploaded.
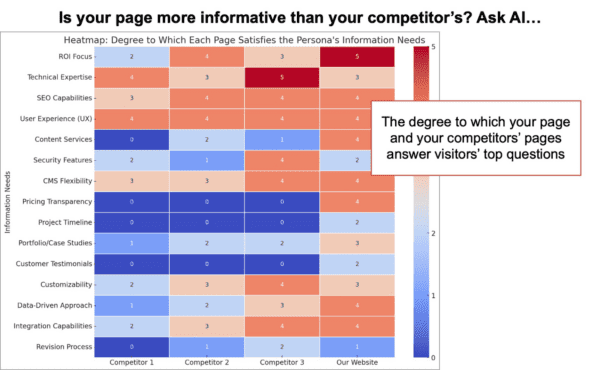
Chart #1: Competitive analysis of your key pages (heatmap matrix)
On the left is a prioritized list of the information needs of your ideal client, based on your buyer’s decision criteria for selecting a company like yours.
On the right, the colors shading the cells of this matrix show the degree to which those information needs are met (or not met) on your page and on your competitors’ pages. Dark blue means the page doesn’t answer their questions at all. Dark red means the page is specifically focused on that topic.
There are no analytics programs that generate this report. But here it is…
How to make this chart: Use these prompts
Ideally, you have documented personas or ICPs (ideal client profiles) which you can load into the AI. If you do, you can skip the first prompt or use prompts that further define the persona.
- Create a persona for a [job title] for a [company revenue] [B2B/B2C] [industry] in [geography]. This person’s goals are to [list goals]. List the goals, pain points and decision criteria for selecting a company that does [your service offering].
- Review the following webpage copy. This is “Competitor 1” How well does this page address or not address the information needs of the persona? [paste in webpage copy]
- Review the following webpage copy. This is “Competitor 2” How well does this page address or not address the information needs of the persona? [paste in webpage copy]
- Review the following webpage copy. This is “Competitor 3” How well does this page address or not address the information needs of the persona? [paste in webpage copy]
- Review the following webpage copy. This is “Our website” To what extent does this page address or not address the persona’s information needs?
- You are a digital strategist and expert at conversion optimization. Create a heat map table showing the degree to which each of these four pages satisfy the information needs of the persona. Make the far left column a prioritized list of the persona’s information needs.
How to use this chart
First, look closely at the pages and verify that the heatmap reflects the copy accurately. And triple check your persona, especially if you use AI to generate your personas. If it’s off, all of this is wrong.
This single chart is a dream come true to the conversion copywriter. The obvious action is to revise your page to make it more informative. That’s the key to website optimization. Improving the clarity should improve both the quantity and quality of leads.
Also useful, this chart shows the differences in positioning between you and your competitors. What’s their focus? Is it different from yours? How do they talk to the prospect? Use those insights to further differentiate your brand.
Finally, notice the opportunities to address concerns that everyone missed. If everyone addresses a specific concern, make sure that your page provides stronger evidence than your competitors’ pages.
And since you’re already in the AI, you can ask it to create an outline or draft for a better page.
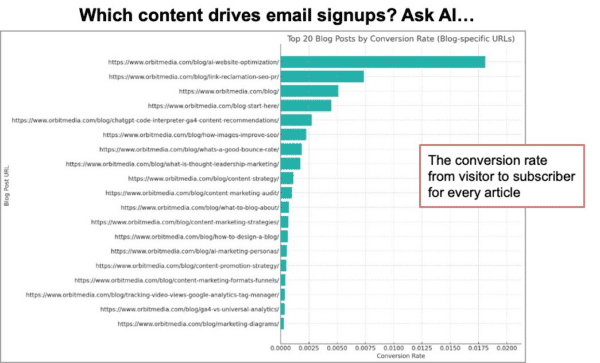
Chart #2: Email signup conversion rate for every one of your articles (bar chart)
Some of your articles inspire action. Others, not so much.
This chart shows which articles your visitors were reading when they decided to give you their email address. Rather than show the total number of subscribers from each article, it shows the conversion rate for each article by factoring in the number of visits.
This is the content that grows your email list fast.
The highest converting articles aren’t the highest traffic articles. These are hidden gems. That’s because low traffic URLs don’t jump out at you from Analytics.
This report doesn’t exist in GA4. But here it is…
How to make this chart: The data and prompts
First you’ll need to export two CSV files from GA4, from an account with properly set up goals. The first shows traffic to all of your content marketing URLs. It’s the Page Path report, filtered to just show the blog.
Next you’ll export a report that shows conversions. It’s the Pages and screens report filtered to just show the newsletter thank you page and with the conversions metric set to signups. Add a secondary dimension for “Page Referrer.”
- I’m giving you Google Analytics data showing traffic to blog posts. Can you analyze?
- I’m giving you data about conversions (visitors subscribing to a newsletter) from that same blog. Can you analyze?
- Merge the data from the two files together into one file, as you would do with a vlookup, so each row is a URL and the sessions and conversions are shown for each. Give me a link to download. [check the file]
- [Use prompts that improve the data] Filter out anomalies. Merge URLs that appear to be duplicates. For any row with a URL that has parameters at the end, combine those values with the row that just has the URL. Remove URLs that do not contain the word “blog”
- Draw a bar chart that shows the conversion rate for each blog post.
For deeper analysis, you can ask the AI to infer marketing topics from the URLs and then categorize by those topics, then redraw the chart to show which topics have the highest conversion rates.
How to use this chart
First, double check your inputs and outputs. Check for accuracy. Look good? Proceed.
There are two main insights from this chart: what to promote more and what to produce more.
What articles to keep promoting? Now that you know which articles are your best mousetraps, you focus on improving the cheese. Share them more. Send them more. Do anything you can think of to drive traffic to them. If you’re low on ideas, here are 76 ways to promote an article.
What articles to keep producing? Look at the articles more closely. Do they share any formats or features? Look at the topics of the top performers. Do they have anything in common? Creating more of these means having more 10x performers and faster list growth.
And since you’re already in the AI, you can ask it to create outlines or drafts for those new articles.
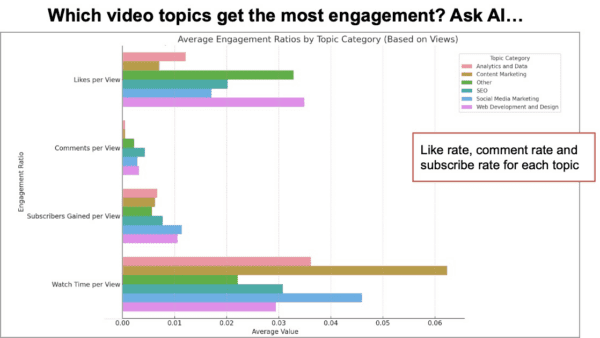
Chart #3: Video topics that viewers engage with the most
YouTube Analytics has a lot of nice reports.
But it doesn’t show the rates at which visitors engaged with your content. So the high traffic videos always look like they’re the most engaging videos. But that probably isn’t true. Your low traffic videos may produce more likes and comments per view than the high traffic videos.
Likes per view and comments per view aren’t YouTube Analytics metrics. It won’t show you this. It also doesn’t categorize your videos by topic.
But this chart does…
The data and the prompts for making this chart
First, go to the advanced analytics section of YouTube Studio. Add all the engagement metrics to the chart and then export to CSV.
- I’m giving you data from YouTube Studio. Can you analyze?
- You are a video content strategist. Categorize these videos into marketing topics based on their titles.
- Analyze the performance and engagement metrics for each topic category. Exclude views and impressions. Show your thinking. Draw a chart.
How to use this chart
First, double check your inputs and outputs. Check for accuracy. Anything look weird? Proceed.
The colors for the topics with the longest bars are the topics that your viewers are interacting with the most. The engagement across topics differs widely. The insights and actions are mostly obvious, but here are some quick suggestions:
- Produce more videos on the topics that get the greatest engagement
- Make sure that you’ve embedded the videos of these top topics everywhere you can
- Produce more articles on those top topic to give yourself more opportunities to embed videos
- Consider stopping video production on topics that aren’t getting engagement.
- Confirm that the names of your best topics are in your YouTube Channel description and align with the categories on your blog.
Try the following prompts for further analysis and recommendations:
- Which words and phrases in video titles correlate with performance?
- Based on this data, suggest 10 video titles and topics that would likely perform well in the YouTube channel.
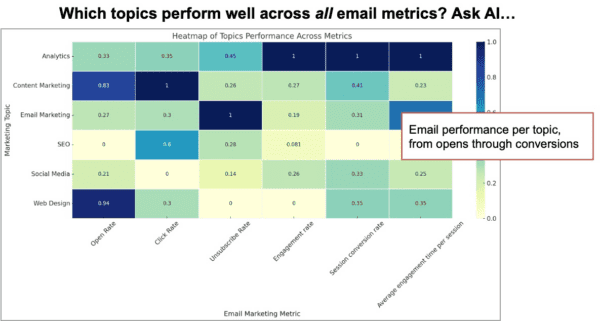
Chart #4: Topics that drive results in emails, from the inbox through the website
Your ESP (email service provider) has data for you: opens, clicks and unsubs.
Your GA4 has campaign data for you: visits, engagement rate, conversion rate
But few email marketers ever combine these data sources into a single report that shows the performance of campaigns across the full funnel: from opens and clicks through to engagement and conversions. And few content strategists ever see full-funnel email stats per topic.
That’s because it’s difficult and time consuming to combine data sources, map together the campaigns and report on performance of campaigns and topically grouped campaigns. It would be a fancy, custom Looker Studio report.
Yet here it is…
How to make this chart: The data and the prompts
The email performance is an export from your ESP. The website traffic performance is an export from GA4. It’s in the Traffic Acquisition report with Session Campaign set as the primary dimension and Date set as the secondary dimension. Create a filter the report shows only data when the Session source/medium contains “email”. Export this report.
Note: this is only possible if you’ve been faithfully tracking your email campaigns with UTM codes, using a campaign URL builder.
- I’m giving you data from [email service provider] about email campaign performance. Can you analyze?
- I’m giving you data from Google Analytics about website traffic from email campaigns. Can you analyze?
- Combine rows so each campaign is just one row. Use the earliest date from that campaign in the date column. Provide link to download. [check the file]
- These two datasets show the performance of the same campaigns both from the email service provider (active campaign) and the website behavior (google analytics). I want to see the performance of each campaign across both datasets. Merge the Google Analytics data with the Active Campaign data, combining “session campaign” and “campaign name” into one column, inferring which campaigns were the same based on names and dates. Provide link to download.
- You are a skilled digital strategist and email marketing expert. Categorize the articles into marketing topics. How do topics correlate with metrics?
- Draw a heatmap matrix table showing the performance of each topic across key email marketing metrics.
How to use this chart
First, double check your inputs and outputs. Check for accuracy. Does it all check out? Proceed.
Notice that some topics may perform well in the inbox, but not so great on the website. Others, it’s the opposite. Seeing this, you can simply set your expectations about the impact of these campaigns, accepting the strengths and weaknesses. Or you can adjust. Here’s an idea:
Create content that spans two topics. Find the overlap, blending the email elements of high performing subject lines with the UX and content elements of high performing landing pages.
Since you’re already in the AI, you can ask it to suggest topics, subject lines and article outlines that would perform well across all metrics.
Try these prompts:
- Describe an email campaign that would outperform in most metrics.
- Suggest adjustments to this email marketing program based on the data provided.
- Based on this data, what type of campaigns should be sent more often? What types of campaigns should be abandoned?
- Based on the data, what 5 possible subject lines would have the highest website conversion rates?
- What open rate, click rate, users, engagement rate and conversion rate would you expect from the following subject line? [enter draft subject line]
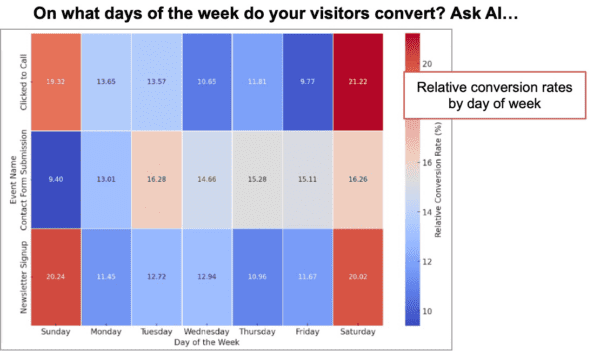
Chart #5: Days of week when your visitors are most likely to convert
Marketers talk about day-of-week when it comes to sending email and posting on social media. (Should we send on weekends? When’s the best time to post?) But it’s rare to hear days come up in any other context.
But day of week is always a thing. It correlates with every action your audience takes, not just in inboxes and social streams. Your audience are more likely to click, read, share, search and convert on different days of week. But there are no reports in GA4 that show day of week.
Yet here it is…
How to make this chart: The data and the prompts
From GA4, using a long date range, go to the Events report and customize so “Conversions” is one of the metrics. Add “Date” as a secondary dimension and export the data to CSV. Open the file and delete the rows where the conversions are zero. That removes the non-conversion events. Next go to the Traffic Acquisition report and add “Date” as a secondary dimension, then export the data to CSV.
You can now have AI build that chart with just three prompts. Here they are:
- You are an expert at analyzing and visualizing marketing analytics data.
I’m giving you one file showing Google Analytics conversion data.
I’m giving you another file showing Google Analytics traffic data.
Can you analyze? - Calculate the conversion rate for each type of conversion by day of week.
- Draw a heatmap matrix with the conversions on the left and days of week across the top. Use row-wise normalization, allowing us to see which days are particularly strong or weak for each conversion rate, relative to the other days of the week for that same event.
How to use this chart
Notice how some days are much better than others. Even after you exclude the weekends, conversion rates rise and call 20% depending on the day of week. Knowing this can help you fine tune your campaigns.
Make your content visible when visitors are likely to act.
- Post more on social media on the high-conversion days for newsletter signups.
- Turn up ad budgets on days when visitors are more likely to act. Pause ads on low-conversion days.
- Pause your marketing (starting with ads) on days when visitors are less likely to act.
Align conversion type with activity levels on various days of week. People apply for jobs on Mondays? Register for webinars on Wednesday? Adjust actions and ad budgets accordingly.
Chart #6: Webpage audit for SEO and conversions
For our final chart, we’re reviewing a highlight from a recent article, AI-Powered Webpage Optimization, because it’s fun.
This chart shows how well a given page does or does not satisfy the prioritized information needs of your prospect, and also how we it does or does not indicate relevance
![]()
How to make this chart: The data and the prompts
As with chart #1 above, start by giving the AI your documented personas or ICPs (ideal client profiles) or use this first prompt to have the AI make one for you.
- Create a persona for a [job title] for a [company revenue] [B2B/B2C] [industry] in [geography]. This person’s goals are to [list goals]. List the goals, pain points and decision criteria for selecting a company that does [your service offering].
- Review the following webpage content. How does it align or not align with the persona’s information needs? [paste in your webpage copy]
- Categorize the following keyphrases into high-level topics: [paste in list of semantically related keyphrases, which you can find using this process]
- Build a table with three columns. In the first column, list all of the persona’s information needs. Prioritize the list with the top priorities at the top.
- In the second column, make the heading “Conversion Clarity (0-5)” and in that column, show the conversion score on a scale of 0-5. The conversion score is the webpage’s ability to both inform and persuade the visitor on a given topic. Give lower scores when the page includes very little information, when the information is poorly supported with evidence, or when the information is indirect or vague.
- In the third column, make the heading “Keyphrase Relevance (0-5)” and in that column, show the relevance score on a scale of 0-5. The relevance score is the extent to which the page incorporates the keyphrases from the keyphrase categories. Give higher scores if the page includes most or all of the phrases from a given category.
That should do the trick.
How to use this chart
The insights are obvious. Revise the page to better meet the information needs of your visitor and to better indicate relevance for the search engine.
Since the topics are lined up in rows, you can do both at the same time.
And since you’re already in the AI, you can ask it to write an outline or a draft. Here are the prompts:
- You are an expert at both conversion copywriting and SEO. You have read every article on the Orbit Media blog. You have read Andy Crestodina’s book, Content Chemistry.Write an outline for a major revision to the webpage. This outline will become the structure for a page that will get scores of 5 across the board.
- Using the outline above, write a revision to the webpage that gets 5’s across the board.
Anytime you see an “Export” button, think about AI
There are limitless opportunities for AI-powered insights. But you’ll need data. So start hoarding your data. Upgrade subscriptions if they give you more data. Record your meetings and convert to transcripts. Ask teammates for their spreadsheets. Look high and low for those Export buttons.
Collect everything.
Connect everything.
For years, the best marketers have been data-driven marketers. Now we are in a new era, where the best marketers are AI-assisted data-driven marketers.
Want to see us walk through all of these use cases and more?
Here’s the replay of our webinar on this topic: How to give your marketing data to AI for turbo insights and impact.