I love fixing pages. It’s like a sport. Make a change, then measure the impact to traffic and conversions. But these pages don’t live in isolation. They combine into a series of pages that create a user experience. A flow.
That flow is a path that has completely different opportunities for improvement. When you look at a series of pages, you may spot issues in the ways they connect with each other.
Today we’ll optimize the entire path, not just the individual pages.
This guide includes an AI prompt for path audits, from first click to final conversion. AI is a lovely way to get ideas for improvement. We’ve shared powerful ways to use AI to improve specific pages, but now we’re going to give AI an entire series of pages …and see if we can spot some opportunities.
Here are some classic problems that occur in the path that you won’t necessarily see when looking just at individual pages:
- Distractions and friction
Unnecessary navigation or visual clutter that pulls their attention away from the goal.
Example: Service page promotes random blog articles - Lack of continuity or mismatches messages
Promises made in one step not carried through in the next or that break the flow of the journey.
Example: The “Start your application” page takes you to a login screen. - Irrelevant content after a click
Pages that don’t match the intent signaled by the previous action.
Example: The case studies page doesn’t have stories relevant to the previous page. - Inconsistent calls to action
Different verbs or styles that confuse or add to the cognitive load.
Example: Visitor clicks on a “See a demo” button and lands on page with “Schedule a time” - Lack of clarity about next steps
Users are left guessing what will happen after they click, creating hesitation.
Example: The user clicked “Schedule a consultation” but the form doesn’t talk about timing. - Missed opportunities for alternate wins
No backup options (mid-funnel conversion options or alternate contact options) for users who aren’t ready or want alternatives
Example: The only option on the path is to create an account. No opportunities to get more information. - Fragmented brand experience
Inconsistent visuals, tone, or interaction patterns from one page to the next.
Example: The homepage and service pages have a friendly tone, but the contact page is boring and impersonal.
Click through your own conversion path with these in mind. When you examine the entire path, and not just the separate pages, you’re considering the complete experience of your visitor. You’re optimizing for the session, not just the pageview.
Because a website visit is more than just one page.
First, sit back and watch a website visit
Before we start the analysis, let’s watch some users click around.
Every digital marketer should watch a session recording at least once in their career. It is enlightening. Set up Microsoft Clarity or a similar tool, wait a few days, then sit back with some popcorn and enjoy the show.
If you’ve never seen a session recording, now’s your chance. The video below includes two: one recording of a human visitor and one recording of an AI agent. Check it out:
The prompt that sent that AI to the website was done in ChatGPT’s “Agent Mode” (this requires the ChatGPT Plus account) and was very simple. We intentionally left out the details. We simply gave it a role, a website and the instructions to see if this company is a good option.
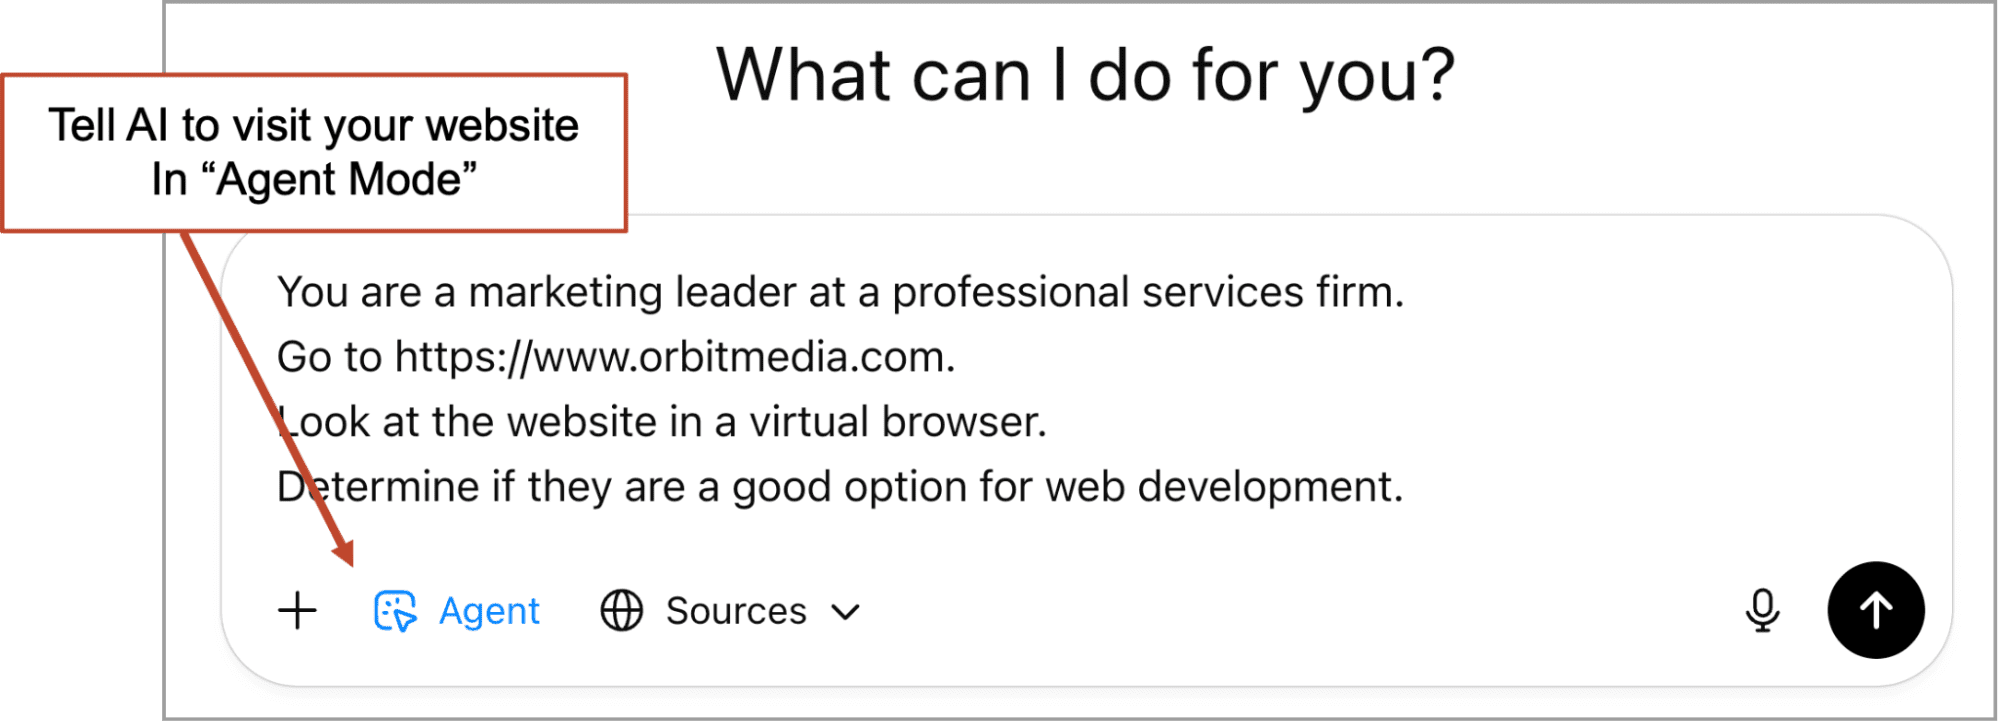 Note: It may take a few attempts before it fully loads the page complete with rendered images. For this kind of UX analysis, you’d rather not have it in “Reading mode.”
The AI agent opens a virtual browser, starts reading and then clicks with its virtual mouse. How similar was the agent’s experience to real human experience?
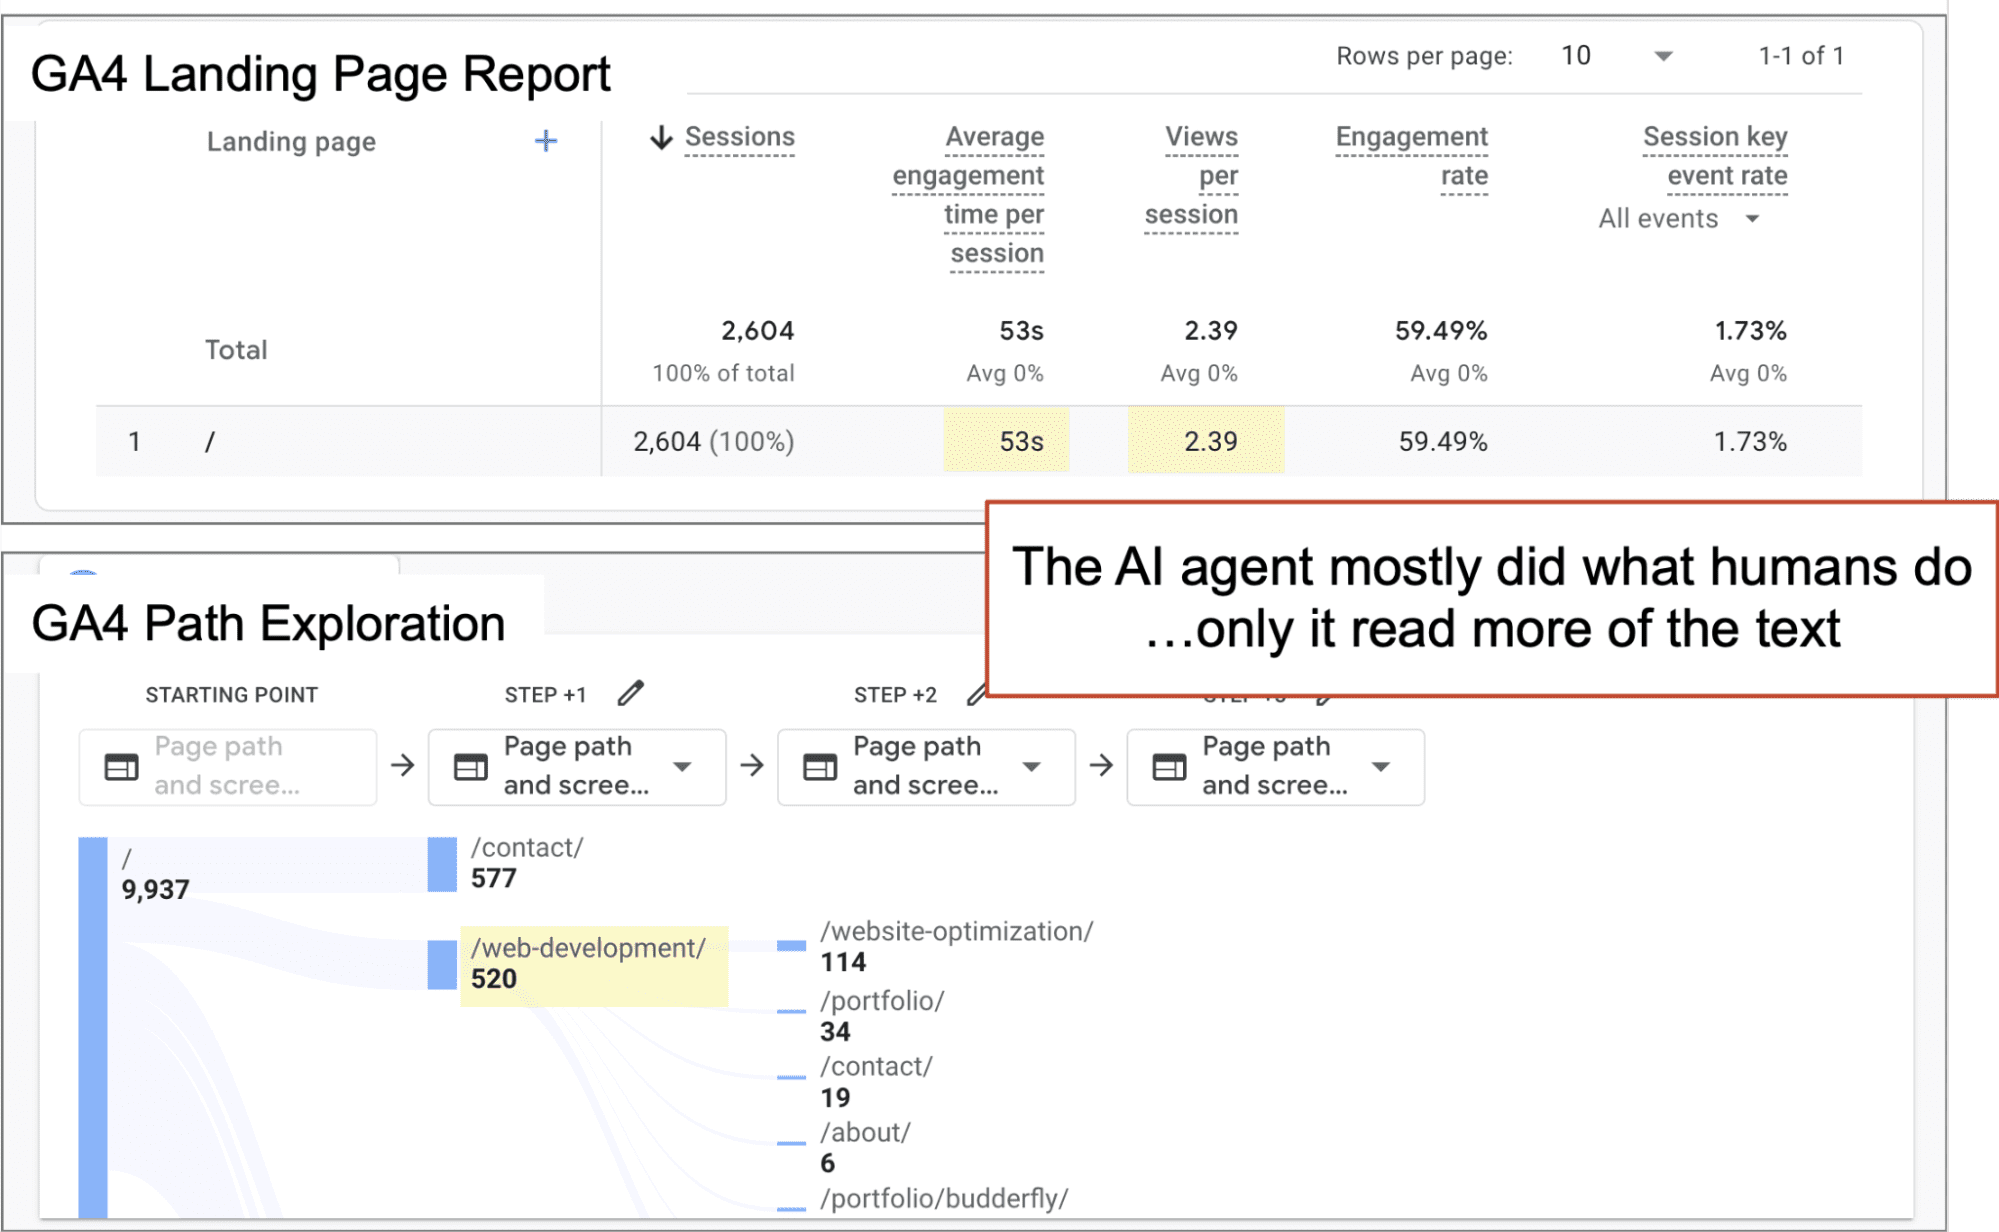
- Very different. The AI moved much slower than the human in the video above. It read pretty much everything on the pages it visited. Humans do not. It spent 5+ minutes on the site. The average visitor who starts on that page spends 53 seconds.
- Very similar. It visited three pages (the average human visits 2.4) and clicked on the most common navigation labels for the intent.
You can confirm this in GA4. Check the landing page report (average engagement time, views per session) and the path exploration. They’ll look like this.
Once complete, you can talk to the AI about the experience and ask for opportunities for improvement. We’ll do more detailed analysis with a path audit prompt in a minute, but here’s the agent’s quick report after this short prompt: “Create a table showing opportunities to improve the path on this website.”
 Like any AI audit prompt, it’s an interesting point of view. It’s up to you to dismiss the bad ideas and how to prioritize the good ones. And this agent wasn’t trained to perform an audit. We are just warming up.
Now we’ll use a much more strategic 3-step method, with a carefully constructed AI audit prompt.
1. Pick the pages in your conversion path
The plan is to give AI screenshots of a sequence of pages in the user flow and tell it to take the perspective of our visitor. The AI may find some opportunities and suggest some improvements.
What pages should we include in what order? That’s up to you. You’ll want two, three or four pages. Pick them using data (actual paths) or assumptions (desired paths). Here are your options:
- Most common paths: Use the series of pages in the most common paths using this GA4 user flow analysis report (go forward: set the “starting point” as the top landing page)
- Most successful paths: Use the series of pages in the most common paths that results in lead generation (go backwards: set the “ending point” as the thank you page)
- Paths from simulations: Use an AI agent, watch the experience then use the pages that it visited in that order. (ChatGPT in Agent Mode with basic instructions)
- Assumed/desired paths: Use the series of pages that you’d like your visitors to use (dealer’s choice)
Make sure to include the page after the call to action, which for lead generation is the contact page. You could also include the thank you page, but since that’s a post-conversion URL, it doesn’t affect conversion rates.
⚠️ Remember, many of your visitors don’t start on your homepage. A properly optimized website has many pages optimized for many phrases. So the homepage is just one of many entry points. These methods can work for any path from any landing page.
⚠️ Remember to consider the mobile experience. Check the User > Tech > Tech details report in GA4 to see how big your typical visitor’s screen is. Use whatever your users are using.
2. Take screenshots of the pages in the flow
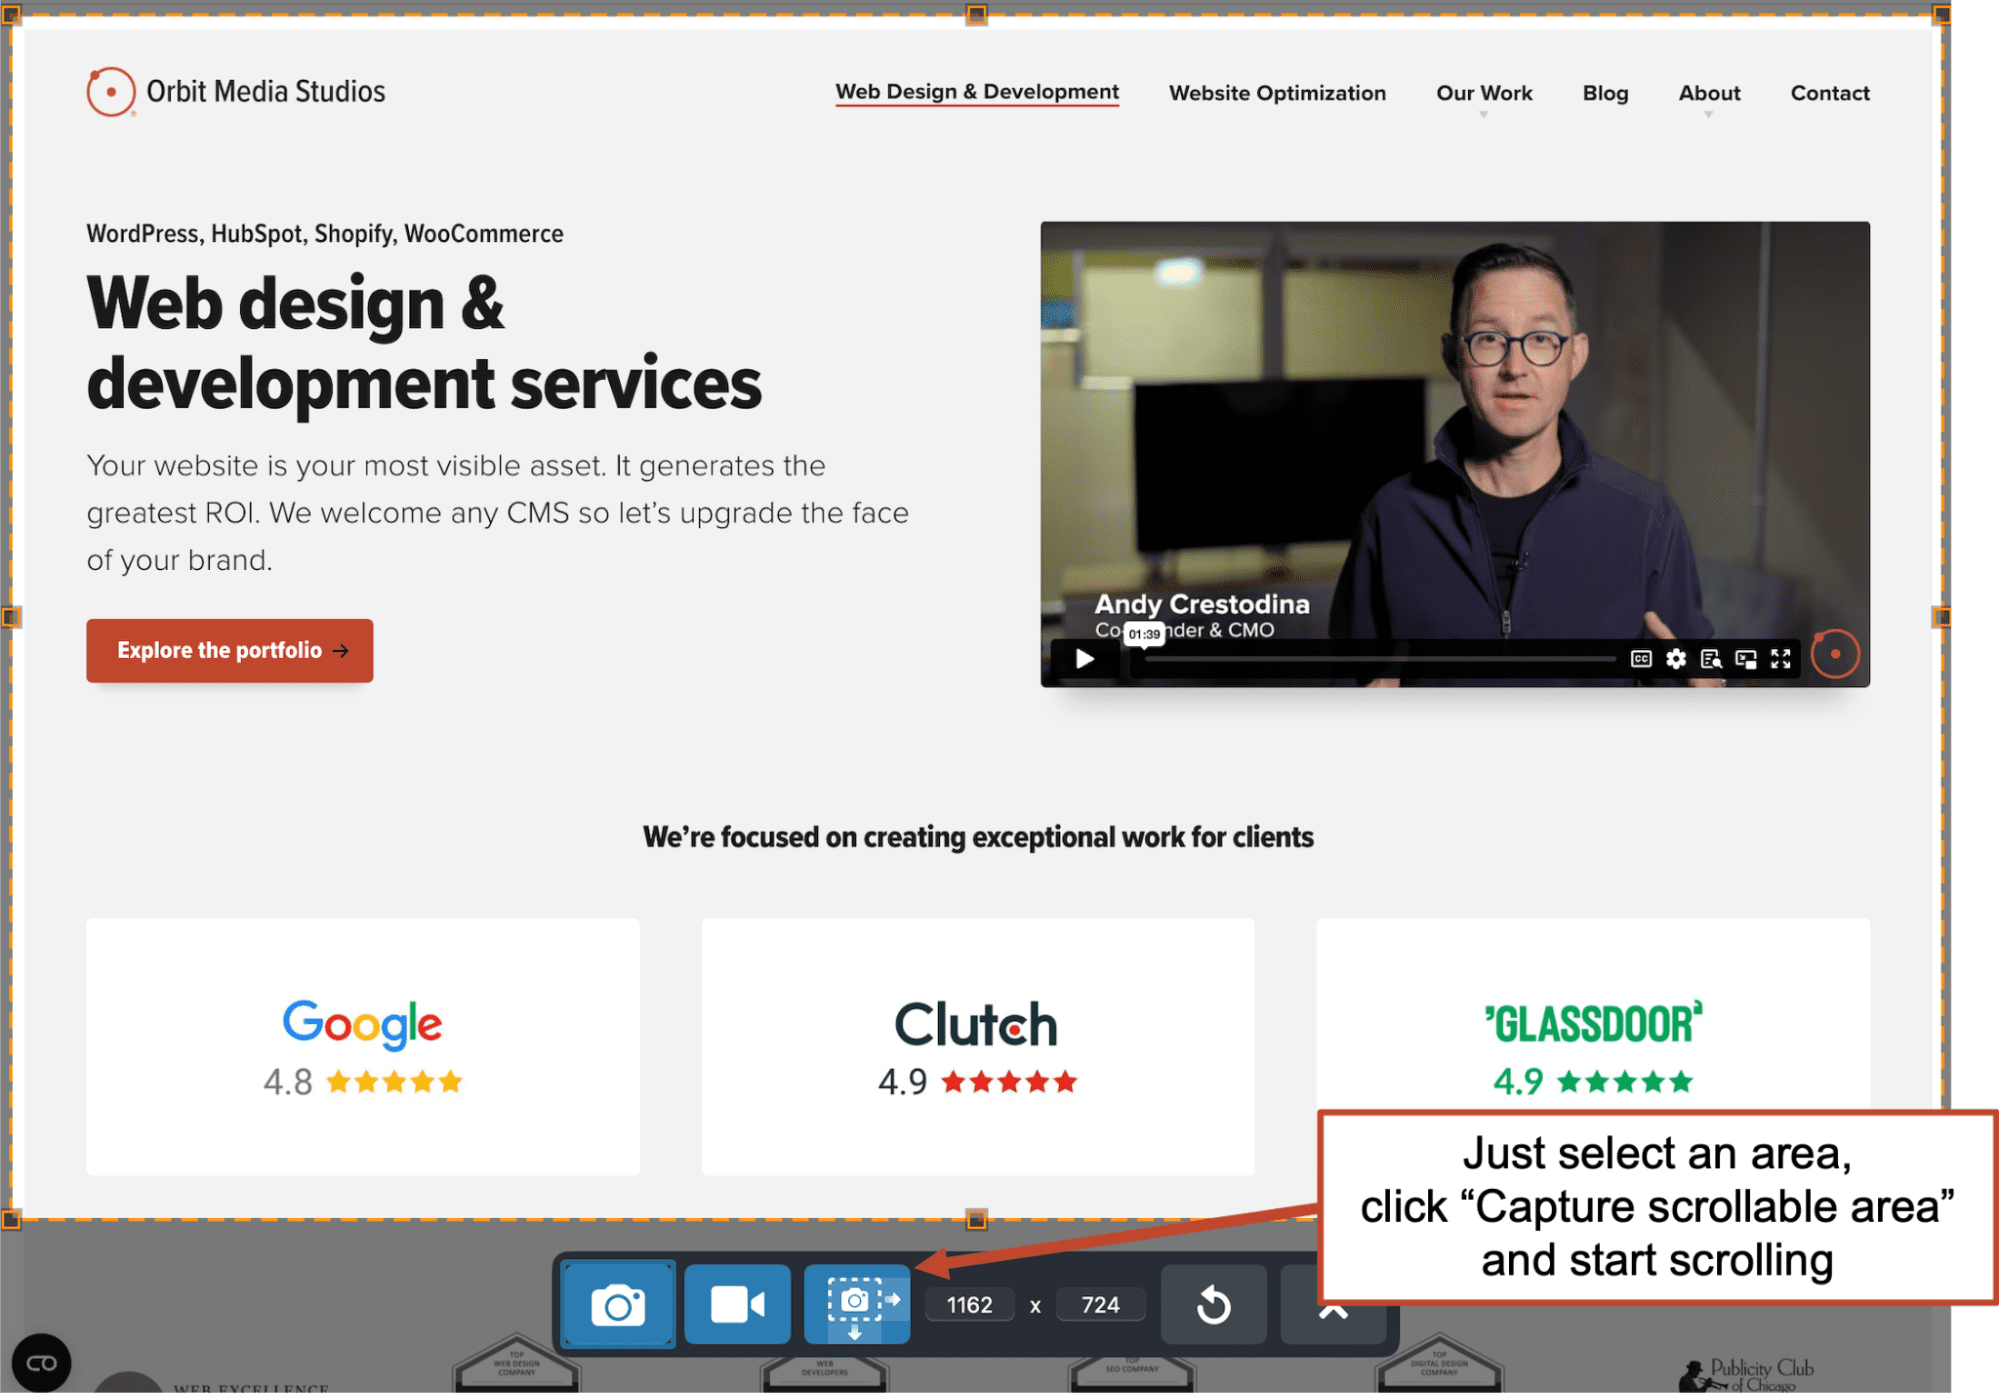
Got your pages picked out? Great. Now go to each page in that flow and take screenshots of each. We’ll assume the visitor is in serious consideration mode and likely to scroll. So we’ll want a full-page screenshot. The keyboard shortcut you may use to capture quick snaps isn’t enough.
To get a full page screenshot you have a couple of options:
- Free browser extension: GoFullPage works well for Chrome users
- A screen capture power tool: Snagit by Techsmith is extremely useful for content marketers. I use it every day. With a quick keyboard shortcut, I select the area, scroll down the page. Now the screenshot is in my clipboard, ready to paste directly into an AI prompt. It’s also how I draw all these boxes and arrows.
 Why not just give it the URLs as links? Because with just a link, AI won’t render the page. It won’t see the images. I can’t review the visual hierarchy. With just links, the AI can’t fully emulate the experience of your visitors.
Since we’re giving AI a series of pages, I recommend saving the screenshots first and giving them names that indicate the sequence of the user flow (such as 1.jpg, 2.jpg, etc.) so the AI knows the order for the analysis.
3. Upload the screenshots to AI with this prompt
Drag them all into your AI of choice. You’ll need a paid version of an AI tool to upload images. It’s worth it. Here’s the prompt:
The AI Path Auditor Prompt
You are a Path Auditor for digital conversion flows. I will upload a series of screenshots of a path. Your job is to evaluate the path as a whole—not just each page in isolation—against my stated conversion goal.
Instructions:
1. Ask me for the main goal of the path (e.g. purchase, demo request, newsletter sign-up) and, if relevant, whether there’s a persona you should consider.
2. Review all uploaded screenshots together, focusing on how well the path flows toward the goal.
3. Generate a path-wide audit with insights across these areas:
• CTA Alignment (do CTAs match expectations and motivate action?)
• Trust & Reassurance (testimonials, social proof, brand consistency, security signals, humanizing details for sales/demo flows)
• Branching & Distraction (are there competing CTAs, nav links, or distractions pulling users off the main path?)
• Positive Off-Ramps (alternate valuable actions if the user doesn’t complete the main one)
• Clarity & Continuity (does each step flow naturally into the next without confusion?)
• Step Efficiency (are there redundant or unnecessary steps that could be streamlined?)When delivering the audit, structure it like this:
• Idea: Identify the issue or opportunity
• Recommendation: Suggest a clear, actionable improvement
• Justification: Explain why this matters for conversion flow success
• Use 🔴 🟡 🟢 to show priority (impact vs. effort)Also include a Score Table (0–100) with color codes indicating strengths for each category:
• Friction Index
• Continuity Score
• Distraction Score
• Trust & Confidence Score
• CTA Effectiveness Score
🟢 80–100 = Strong | 🟡 60–79 = Moderate | 🔴 below 60 = WeakKeep your tone clear, consultative, and practical. Focus on actionable insights that improve conversion continuity and effectiveness.
This prompt asks the user if they would like to include a persona. If you have one, share it with the AI. It’s an excellent way to make all of the recommendations more relevant and more specific. If you don’t have one, use these prompts to create an AI generated persona.
The output will be a color-coded mini-report. As with any of our AI conversion page auditors, review the reports with a critical eye. Don’t hesitate to dismiss any of the recommendations that you find unhelpful. Trust your own digital strategy skills. AI is simply a helpful perspective. If you get a few good ideas, that’s a win.
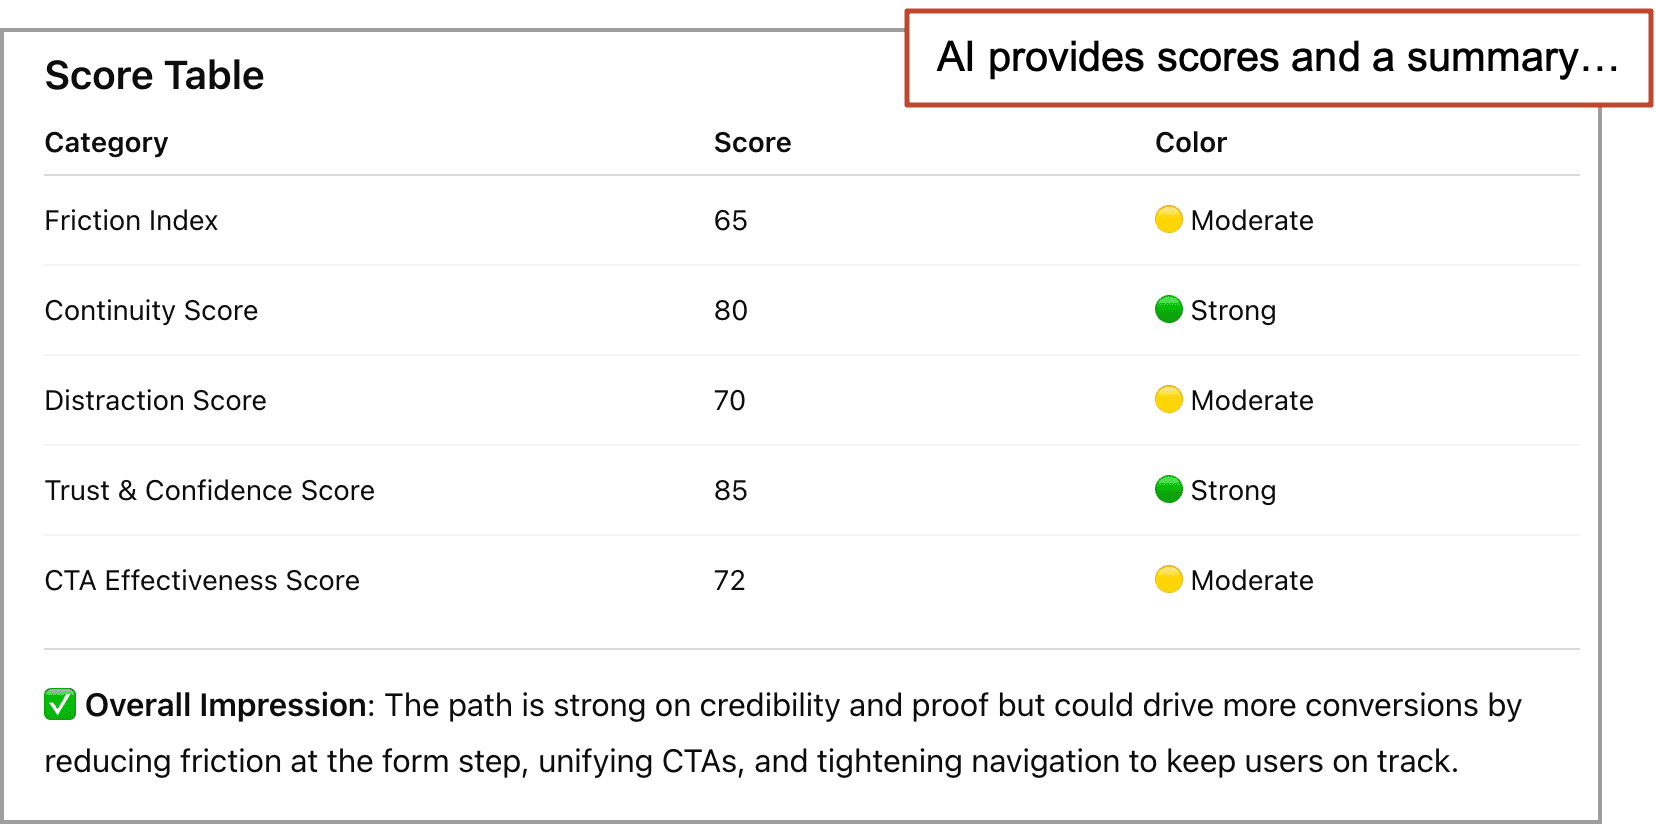
Example: AI audit of a lead generation flow
We’ll use the Orbit Media website as an example. Here’s the analysis for a conversion path with four pages: Home, Web Development, About and Contact.
Our data shows that most of our actual lead generation conversions are even shorter, likely because most of our leads were already brand-aware. But this will make a nice demo.
The true path would include the thank you page, which is when GA4 records the key event. But since that’s after the final click, we can leave it out of the audit.
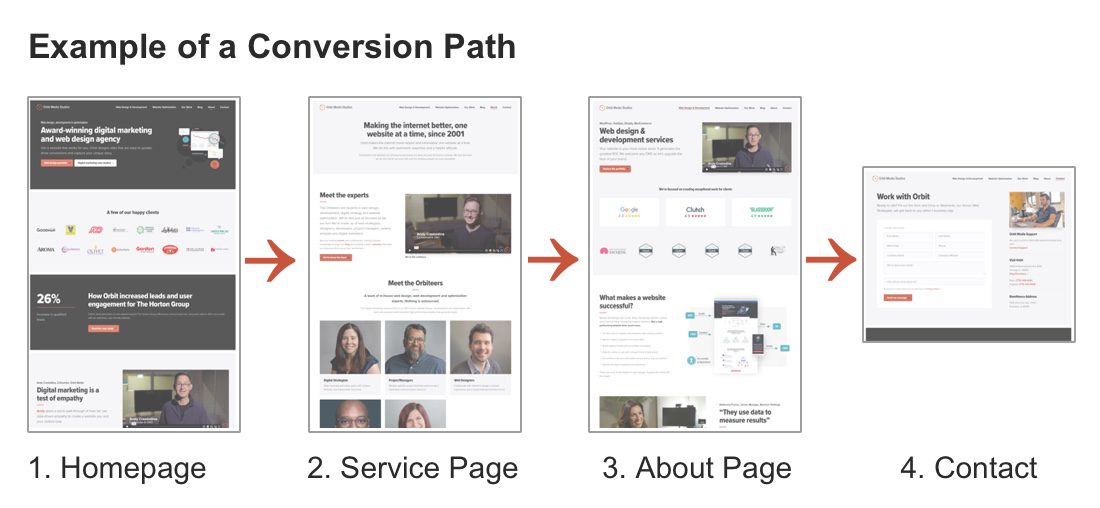
We took these four screenshots and uploaded them to ChatGPT with the prompt above. The AI reviewed the pages in the context of the flow, then generated recommendations. Some of these could have been spotted by a prompt that audits pages, but others are very specific to the context of the pages in sequence. The path.

At the end of the little report, the AI provides a little scoring matrix. Our site is filled with supportive evidence so we did well in the trust department. But it thinks we could do more to reduce friction with tighter messaging.
In the final step, the digital strategist, the UX specialist and the conversion copywriter have a meeting. Or that may be one person. Or send this to your web partner for their perspective. Of course, AI will be happy to chat with you and help prioritize your hypotheses.
I reached out to one of the world’s great conversion copywriters, Jo Wiebe, for her input on paths over pages. It’s so good. Read it slowly.
 |
Joanna Wiebe, Copyhackers“When looking at the entire path, do you see – clearly and unquestionably – where 100% of people in the flow see their problems on the page? Problems create customers. But people love to forget their problems. So marketers have to remind them. If you can look early in your funnel – and recently in their experience – and not obviously identify in your copy…
…then why should they convert? Hell, why should they read, watch or pay any attention? It’s a myth that people throw money at good solutions. They throw money, time, love, and passion at solutions to big, hairy, horrible problems. Sell a bigger, scarier mouse, not a better mousetrap. Align with them in their battle against those stated (not implied) problems.” |
Whatever changes you make, you have three benchmarks to measure the impact..
- Clickthrough rates on the calls to action (GA4 Path exploration)
- Drop-off rate on subsequent steps/completion rate of the final form (GA4 Funnel exploration)
- Key event rate for the specific goal (the ultimate metric for conversion!)
The job is to improve those numbers. Make them higher next month than last month. Beat yesterday!
Conversion is a path …great pages are insufficient
We’ve all been there. We’ve all felt friction. We’ve all clicked and then said “wait… what’s this?”
You may have a set of beautifully crafted pages …that feel totally disconnected to your visitor.
Never forget that your visitor is flowing through a series of pages. Even if each separate page is strong, they need to be string together. They need to guide the visitor by using consistent messages, minimal friction and few distractions, pulling them forward toward the goal, page by page.
That’s how leads are born.