Let’s be honest. The Internet doesn’t need another medium-quality blog post with general advice. There are already millions of posts published per day. That’s a lot of content.
So here’s the most important question in digital marketing: How do you rise above the noise?
The answer is simple: create a survey that produces new data. The Internet wants originality. It’s the original research that gets clicked, read and shared.
A marketing survey is the easiest way to produce something truly original, something new and unique to your website. Original research can provide the data that will make your site a reference and resource for your industry.
But a survey of what? Here’s how to make a survey that will make you famous in your field. First you have to pick your topic.
Find the Missing Statistic
Every industry has conventional wisdom. It’s common knowledge that everyone agrees on, but it’s so common that no one questions it. They don’t research it. They don’t support it with data or statistics.
There are “missing stats” in every industry. They always meet two criteria:
-
They are frequently asserted
-
They are rarely supported
If you find the missing stat and support it with data from a survey, you’ll have proved the conventional wisdom, making your website a source of original data.
Here are some examples of industries, common assertions and hypothetical missing stats. Each of these could be discovered through a marketing survey.
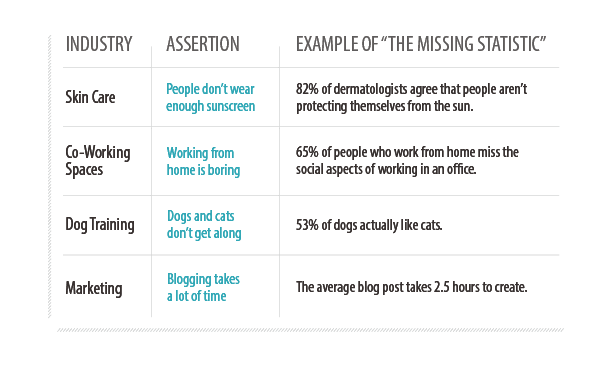
That last one is a real example. It’s a statistic that we discovered through a simple survey, filling in a blank in our field. Everyone says “blogging takes time” but no one had answered “how much time?”
It was often stated but never supported. So we created a blogger survey and asked the question. Here’s what we learned.
UPDATE: Our blogger survey has been updated with new data and analysis. View the latest Blogger Research Survey >
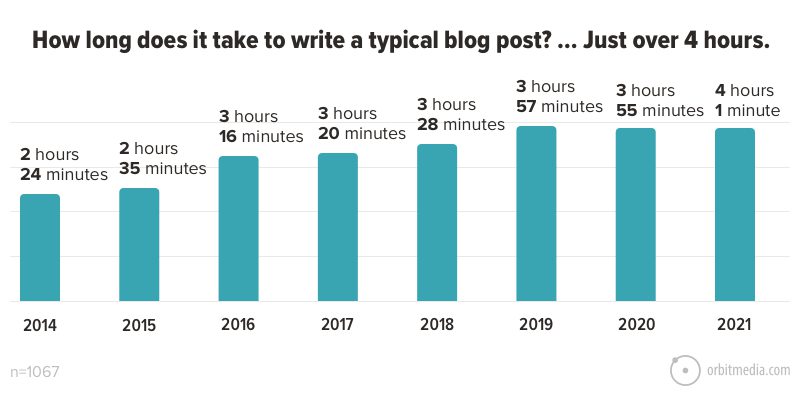
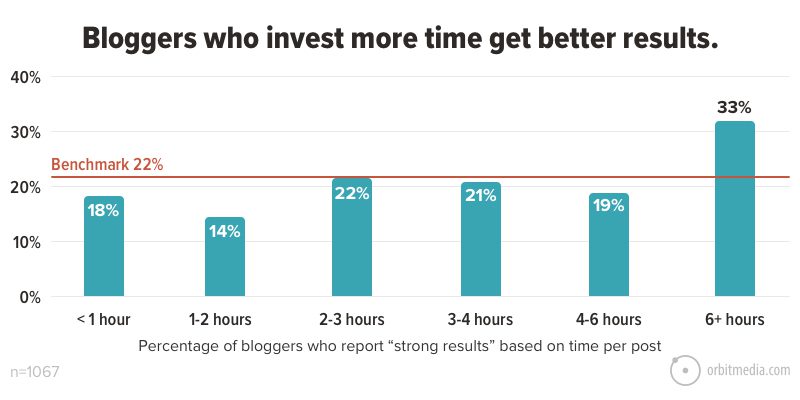
With just over 1000 survey respondents, we discovered this “missing stat.” On average, bloggers spend about a little over 4 hours on a typical post. We became the first site to publish that data. Here’s what happened next.
The Search and Social Benefits
This post was by far one of the most successful pieces of content we’ve published, which isn’t really a surprise considering it’s also the most original. Here’s the breakdown:
It was shared 1,800 times on social media networks.
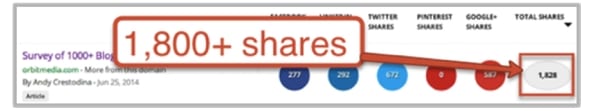
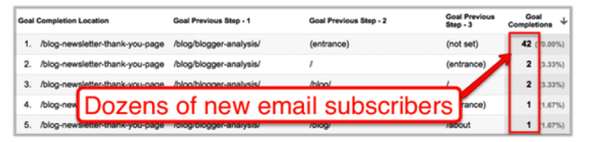
For our little site, that’s a lot of shares. It also triggered more than 100 comments. But the benefits went beyond social media and traffic. It attracted dozens of new email subscribers.
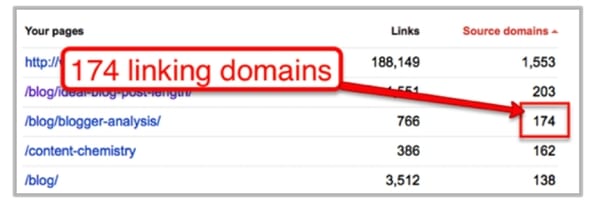
Best of all, the survey was referenced all over the web. It was mentioned on podcasts, included in roundups and ultimately linked to by more than 170 different websites, giving us a durable advantage in organic search.
But those mentions didn’t happen magically. We did a lot of manual, PR-style outreach, pitching various angles to the big, authoritative blogs in our industry. This led to coverage and mentions on sites like Marketing Profs and Copyblogger.
Eventually, it was picked up all over the world. Our little marketing survey was translated into Russian, Japanese and Hebrew.
How to Create A Survey …that Finds the Missing Stat
We published a detailed post that describes how we created and promoted our original research. Here’s the short version:
-
Create a list of survey questions, designed to discover a statistic that is new and supports your marketing message.
-
Set up an online survey.
-
Calculate the minimum number of respondents to create statistical significance.
-
Build an initial list of potential respondents and places to post and promote the survey.
-
Create an incentive to take the survey (optional, but effective).
-
Promote the survey like crazy until you have a statistically significant dataset.
-
Analyze the findings to discover the missing stat and any other insights you can find.
-
Publish the survey with pretty charts, contributor quotes and an attractive featured image.
-
Make visual, sharable graphics that contain the statistics you created. We made six of these, each of which contained a different insight. See the example below.
-
Promote the analysis like crazy, making it visible to influencers, bloggers and the media.
For us, the entire process took more than 150 hours, which is 10 times the effort of a typical post. But as we showed above, the results were far more than 10 times our average.
One Survey, Multiple Insights
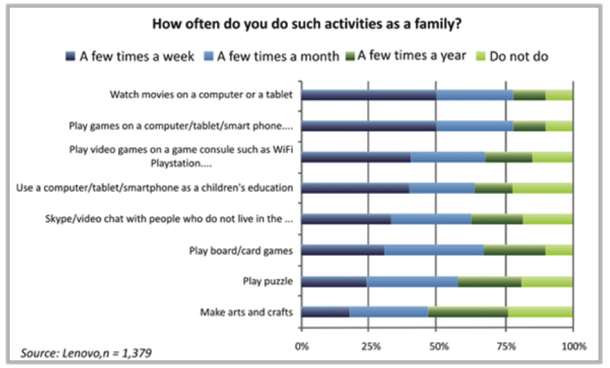
A well-designed survey will produce several data points, each of which will be newsworthy. Even a single question survey can produce several statistics. Take a look at this survey from Lenovo.
Plan ahead and you’ll have data for several posts and several pitches. For more insights (and tips on writing press releases to promote a survey), see the ResearchScape Newsmaker Whitepaper.
Beyond the Typical Survey
Here are a few alternate approaches to making surveys that offer different benefits:
-
Surveys with Networking Benefits: The Phone Interviews
Rather than getting a little data from a lot of people, get a lot of data from the few people who really matter. Make a list of 25 people who are experts in your topic AND fit a profile (or job title) of people you’d like to connect with. Now call each of them on the phone for a 10-minute survey. The data may not be statistically significant, but you make friends while you produce data. -
Surveys with Promotion Benefits: The Blogger Dataset
Survey a group of respondents who are more likely to share, mention and promote the survey, such as bloggers. Collaborating with content creators is a super powerful marketing tactic that gives you a natural advantage when it’s time to promote the findings. -
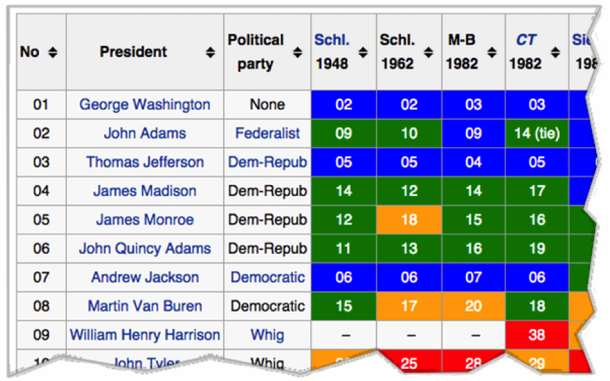
Surveys with Credibility Benefits: The Meta-Survey
Rather than creating a new survey, aggregate the results of past surveys within your own methodology. This creates new data in a way that is often more trustworthy than any single survey. This is Nate Silver’s approach to political polling. It’s also how Wikipedia publishes a credible list of the best Presidents in US history.
Be the Go-To Resource in Your Industry
No matter what business you’re in, there are “missing stats” in your industry. Baseless assertions are made every day, just waiting for data to back them up.
So find the gaps, make the survey and publish the missing statistic. Now, when people make the claim, your data will be there to support it. They’ll share, mention and link to you like crazy.
Publish the missing stat in your industry. The Internet will thank you for it.