Every number in your Google Analytics account is wrong.
Maybe the reasons are obvious. Some visitors block tracking codes. Some don’t accept cookies. Some browse in private mode. We all have the right to not be tracked.
Maybe it’s not a big deal. You don’t need perfect data to find insights. The specific numbers aren’t that important. There are still plenty of useful insights in every GA4 account.
But how inaccurate is Google Analytics?
It’s still an interesting and important question for digital marketers. Today we are answering that question. We’ll show our approach for measuring how inaccurate GA4 is. We’ll also show you how to check this for yourself in your own account.
Spoiler alert:
- GA4 underreports traffic by 11% for sites without cookie consent banner
- GA4 underreports traffic by 20% for sites with cookie consent banners
Why is GA4 inaccurate?
Because there are so many ways to avoid being tracked.
Google Analytics records data when a little bit of Javascript (gtag.js) talks to cookies on the visitors device (_ga, _gid, etc.). If this little conversation doesn’t happen, no data is recorded in GA4. There are many reasons for this. The big ones are related to privacy and the trend toward Do Not Track (DNT).
- Ad blockers
- Do not allow cookies (through a consent banner)
- Browser privacy settings (and incognito mode)
- Cookies disabled (browser-level)
- Firewall restrictions (within corporate networks)
There are several other reasons (could be GA4 setup problems!) but these are the big ones. So GA4 underreports all traffic and conversions, but there are other ways to record activity on your website…
How can you measure the accuracy of GA4?
You compare Google Analytics to other sources of truth.
Even if the visitor uses an ad blocker or doesn’t accept cookies, they may still submit a contact form, subscribe to a newsletter, buy a product, make a donation, apply for a job, etc.
So the databases that record these actions are a better sources of truth. They are in the records in your systems. They are in your CMS (WordPress) or marketing automation tools (Hubspot), the leads in your CRM (Zoho), the sales in your ecommerce system (Shopify), etc.
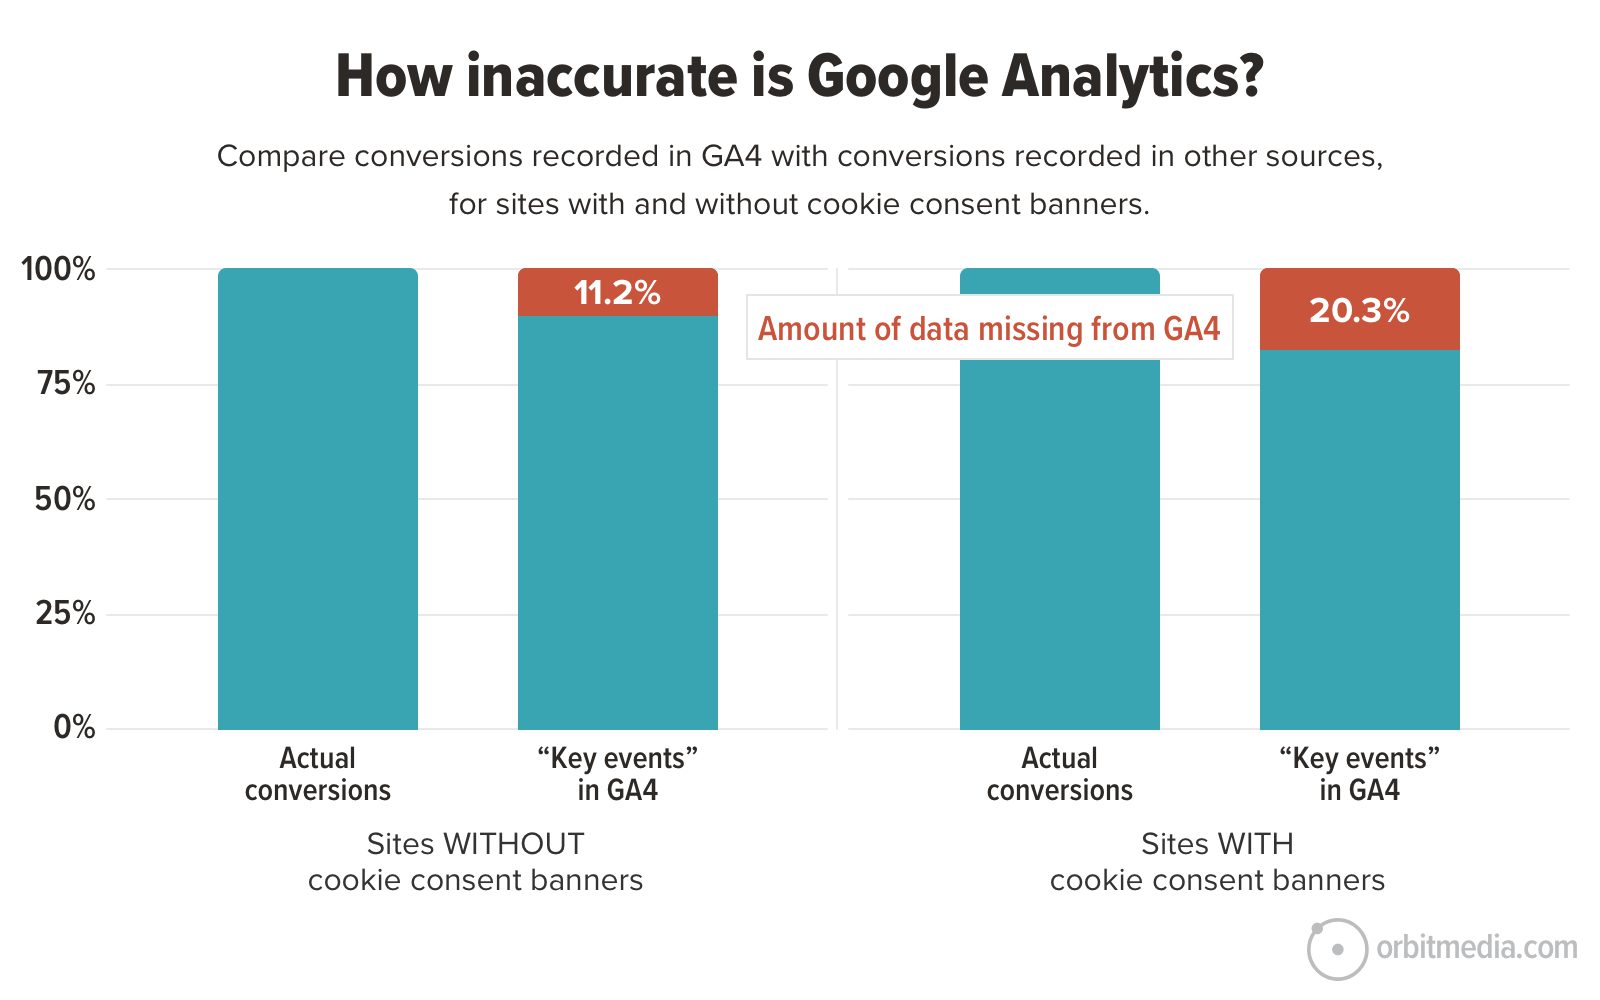
Comparing the recorded conversions with the “key events” in GA4 shows us how much GA4 is underreporting.
You can do this for yourself very easily. Just pick a nice long date range in both tools and compare the data. If Hubspot shows 100 leads and GA4 shows 85, then GA4 is underreporting 15% of leads.
We did this 60 times, comparing various recorded conversions across 33 accounts, comparing newsletter signups, get-a-demo requests, ecommerce revenue and many other interactions in many other databases and in GA4.
We also compared our own GA4 traffic (not just key events) with traffic from Plausible, a cookieless analytics tool. We’ll show you that comparison below.
We measured the inaccuracy of Google Analytics for accounts for sites with and without cookie consent banners. Sites that use a consent management platform (CMP) such as Cookiebot give the visitor the option to accept cookies. When visitors are given the option, some visitors choose not to be tracked, so those accounts have slightly less accurate data.
Here are the average levels of underreporting by Google Analytics.
- 11.2% of data is missing from websites that don’t use a cookie consent banner.
- 20.3% of data is missing from websites that use a cookie consent banner.
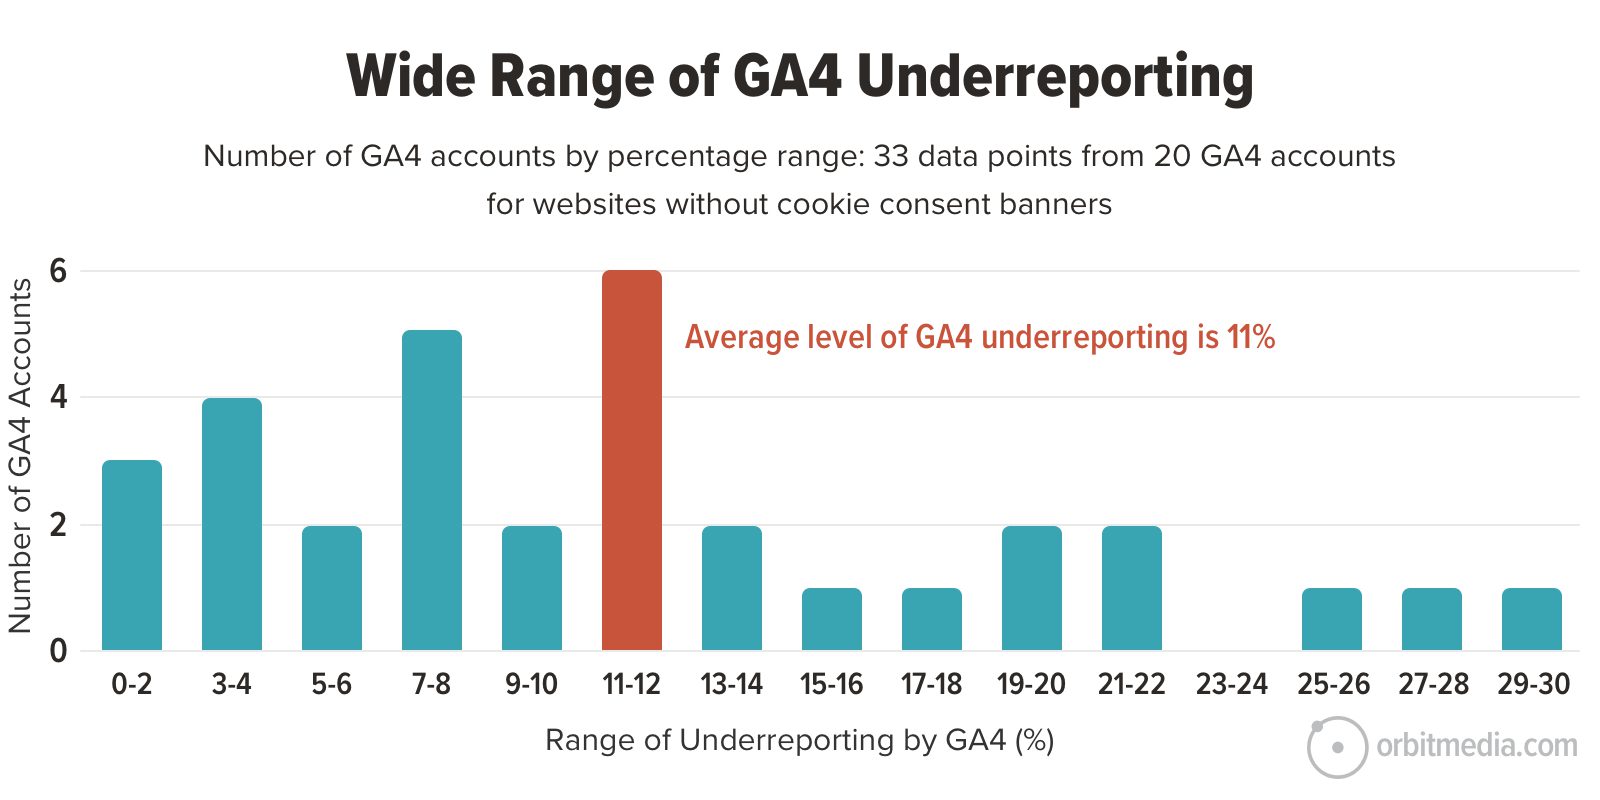
Looking more closely at the data, we see that the level of underreporting varies widely across accounts.
Here you can see the number of comparisons in each percentage range for sites without consent banners. Although the average was 11%, sometimes the data was off by just 1%, while others were off by 30%.
We separated the accounts that use a cookie consent banner from those that do not. Let’s look closer at the impact of all of those “Accept Cookie” buttons.
How do cookie consent banners affect GA4 accuracy?
It’s courteous to let people opt-out of tracking.
It’s also good to comply with privacy laws.
The two biggies are the European Union’s GDPR law (General Data Protection Regular) and California’s CCPA law (California Consumer Privacy Act). To comply with these, website owners need to use a CMP (Consent Management Platform) which puts a cookie consent banner at the bottom of the website, at least for visitors in EU countries and California.
The Orbit Media site uses a cookie consent banner for visitors from those places. So we’re able to compare those users to other users to estimate the impact cookie consent banners have on GA4’s accuracy.
Here we’ll use another method to measure the difference. It’s more accurate, but uses a smaller dataset. We’ll compare traffic recorded in Orbit Media’s GA4 to traffic recorded in Plausible. Plausible is a cookie-less and GDPR-compliant analytics tool. It tracks traffic using only Javascript. No cookies (or consent) necessary.
In both GA4 and Plausible, we separated the traffic from places where the banner was shown (for us, that’s California and European users) with traffic from places where the banner wasn’t shown. It was a tedious process but it revealed the recorded traffic impact of the cookie consent banner.
- 15.8% of traffic data is missing when users were not shown the consent banner.
- 55.6% of traffic data is missing when users were shown the consent banner.
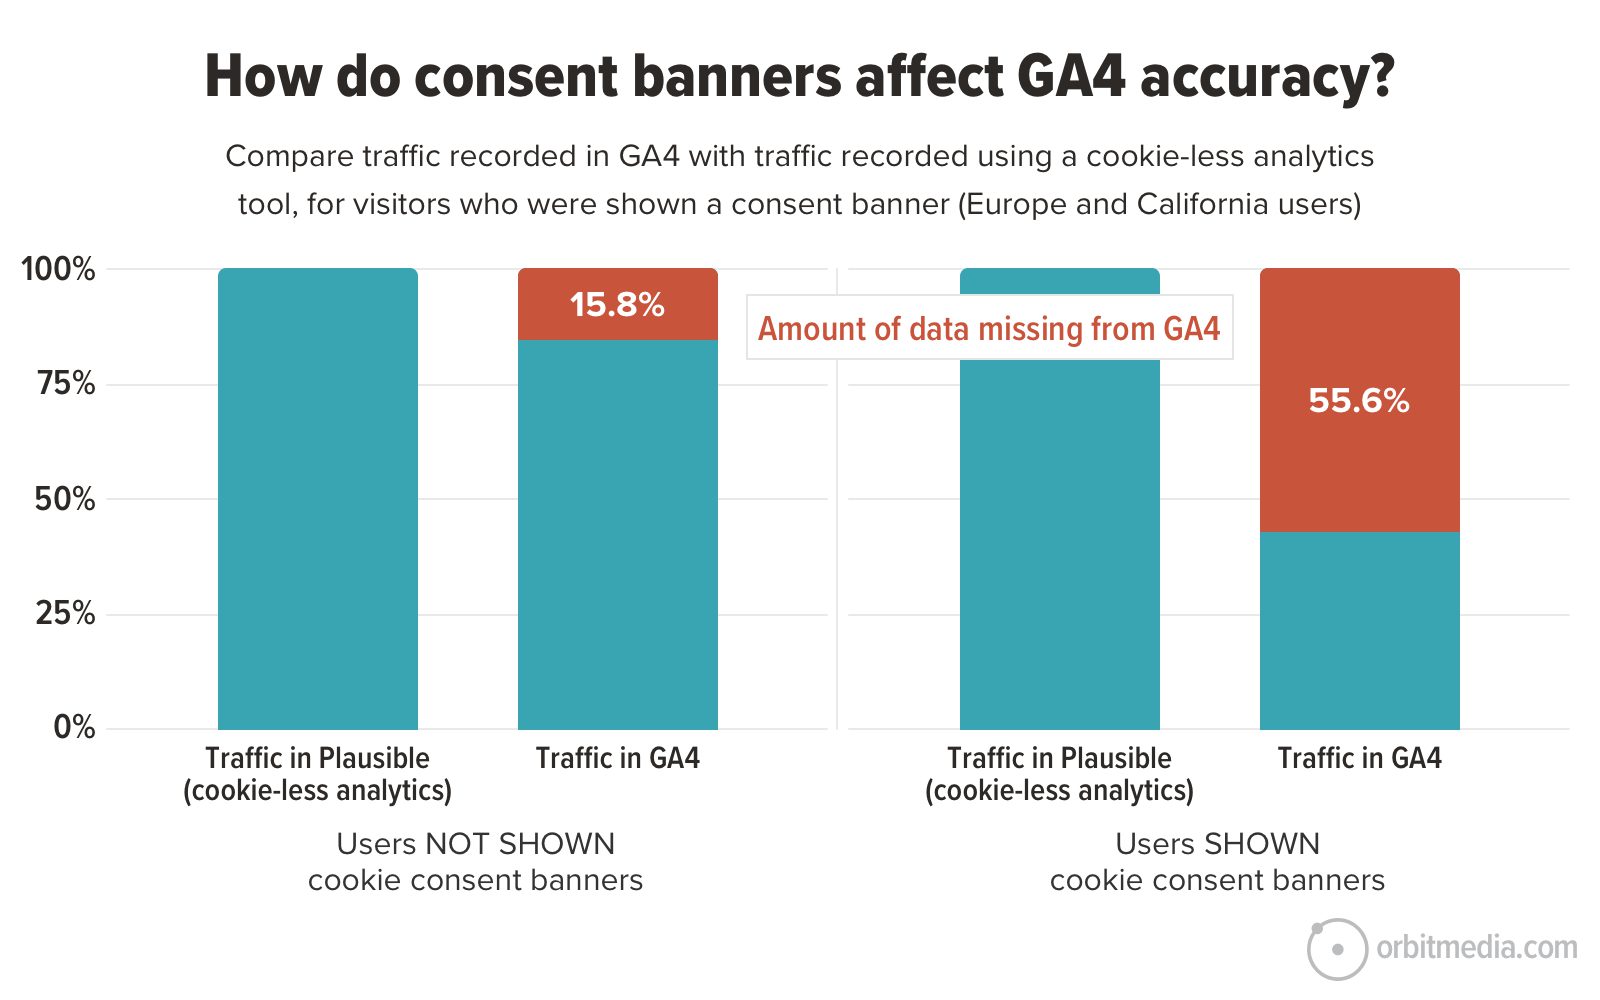
Note: This is different from the data above because although those websites use consent banners, they may not show it to all users. Here we are looking specifically at users who did and did not see the banner.
Remember, cookie consent banners do not affect your traffic. They only affect your recorded traffic. And 45% of your traffic data is plenty to get valuable insights. A true GA4 pro can come up with great hypotheses and make informed decisions while looking at small datasets. Of course, accounts with very low data have other issues. Those GA4 reports are sometimes filled with internal traffic.
Keep in mind, this analysis above is all from one GA4 property with a dataset of around 115K users. The impact of the consent banners varies widely on three big factors.
- Who sees the banner
Is it shown to everyone? Just Europe? Europe and California? What about Canada? I’m not a lawyer, but the GDPR law states that any website with any visitors from an EU-member nation is subject to their laws. That’s every website. Ask a lawyer and they’ll recommend the most cautious, compliant approach. Banners for everyone! - The banner size, UX and text
Consent management platforms give you options for the style and settings in their banners. They can be simple and subtle or large and intense. - Explicit vs. Implied consent
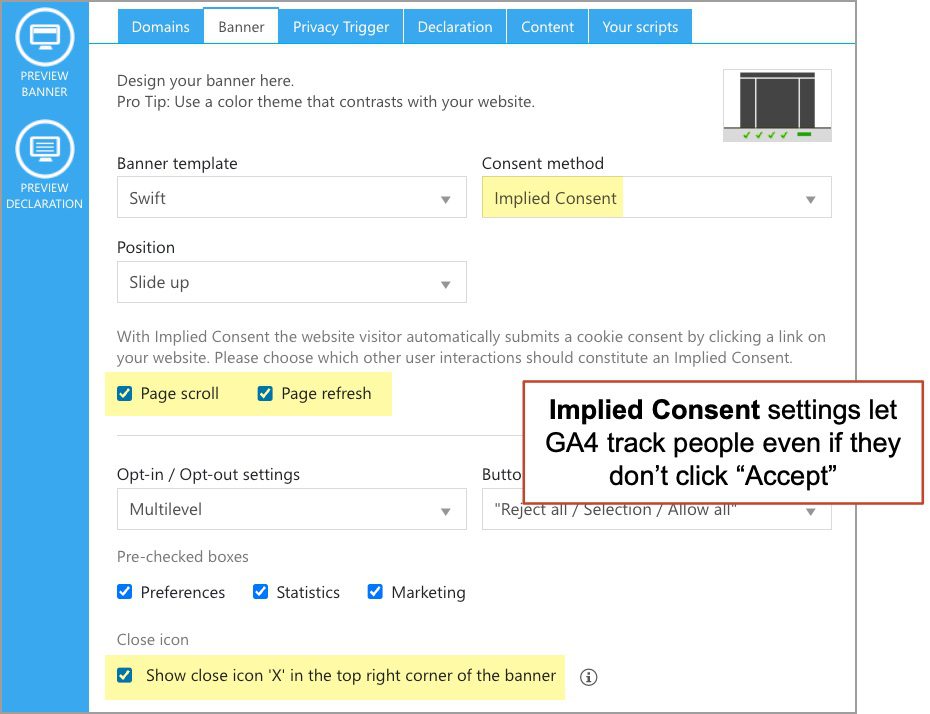
This determines when the consent banner tells the Google Tag Manager to trigger all the marketing tags, if you have it set up properly. Explicit consent means the visitor has to click “Accept.” Implied consent means the visitor ignored the banner but scrolled or clicked on something.
Of course, implied consent will allow you to gather more Analytics data, but it is not GDPR compliant. Here’s what the most permission settings look like:
Our friend and GA4 expert has some tips for better data quality and tracking issues. She has been explaining marketing analytics inaccuracies for years.
 |
Dana DiTomaso, Kickpoint Playbook GA4 Courses“Don’t try for 100% accuracy in GA4 – it isn’t possible. Instead, make sure that the data that you do have is of good quality. Some tips:
|
Now you know the average level underreporting for all GA4 data. That’s conversion tracking gaps, inaccurate real time data and missing transactions, regardless of the traffic source and attribution model. Keep in mind that metrics showing percentages (bounce rates, engagement rates, conversion paths, key event rates) should be more accurate, regardless of privacy tools and user behavior.
The future of the web: more privacy and less data
It’s safe to predict that more privacy laws are coming. It’s likely that in the future, more users will use tools that protect their privacy. Big tech that prioritizes users (Apple, Mozilla) will get better at blocking trackers by big tech ad companies (Google, Meta)
This all means a bit less data for marketers.
 |
Marko Saric, Co-founder of Plausible Analytics“GA4 is a bit of a mess. We frequently hear complaints about its user experience, privacy implications and surprisingly, its data accuracy. It is significantly impacted by cookie consent/GDPR banners, privacy-focused browsers and ad blockers. And the data modeling used to fill in the gaps caused by the missing data doesn’t seem to be that accurate either.” |
What is GA4 data modeling?
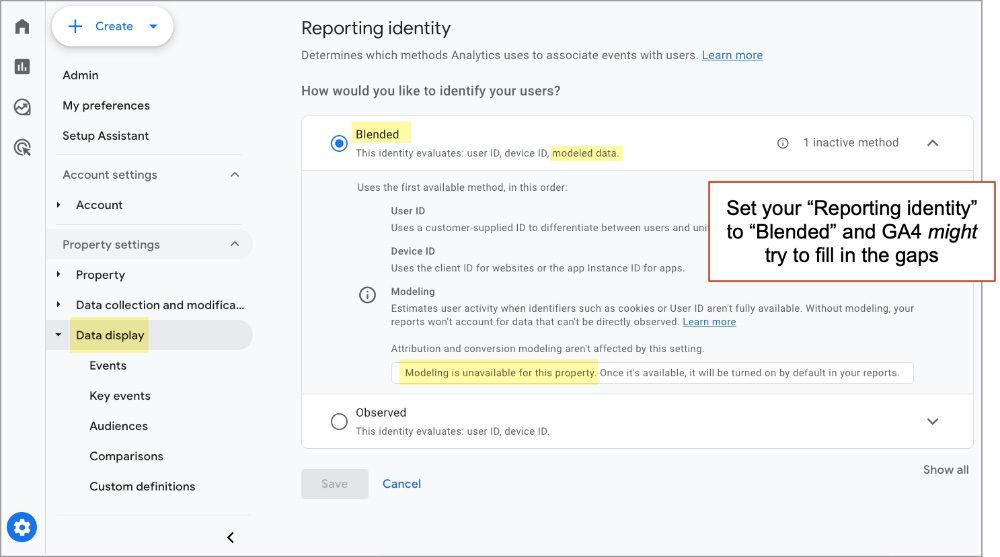
The Analytics team at Google tries to fill in these gaps with data modeling based on machine learning, but this doesn’t work for everyone. You need to have consent mode turned, you need to have enough traffic and you need to set your “Reporting Identity” to Blended. Then it might work.
Even if it does, it will never know how many visitors are using AdBlock or in private browsing mode. This is Google making its best guess.
There’s another gotcha with Google Analytics guessing, according to friend and Analytics pro, Chris Penn.
 |
Christopher Penn, co-founder of Trust Insights“The problem is that not every audience is the same. If our data were missing at random, we could be assured that the guessing was more or less accurate. When data isn’t missing at random, then we run into problems. For example, iPhone data is often missing due to Apple’s privacy protections. Are iPhone customers different from Android customers? You bet they are. They’re a different demographic with different purchase patterns. Is GA4 compensating for that? We don’t know. If a missing audience is assumed to behave the same as the existing audience, there could be disastrously wrong assumptions.” |
What about GA4 consent mode?
Google has also launched Consent Mode V2 which is a method for having your consent management system tell GA4 that your visitor has granted or declined tracking. The idea is that if they decline to be tracked, Google will know you have a visitor, but track them just a little bit.
Ironic, right? Tell the tracker you don’t want to be tracked!
What about other sources of data?
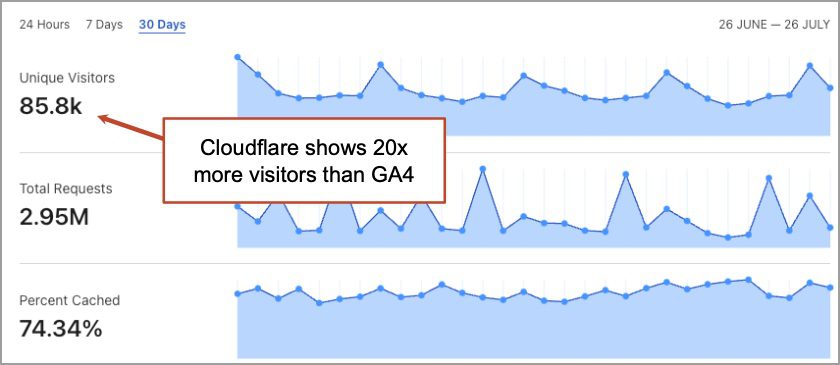
Beyond GA4, there are other places to look for more accurate website data, such as your CDN or server logs. Server logs are the ultimate for accuracy because nothing can hide the fact that pages are being served. But they’re hard to check and don’t have great reporting. And because they don’t filter bot traffic the numbers might look very strange.
In this screenshot, Cloudflare shows 20x more users than GA4. How many bots are out there? This isn’t helpful…
In a separate analysis comparing GA4 to Matomo (an open source analytics package that runs on the server), Chris found that GA4’s traffic numbers were incorrect, but they were unpredictably incorrect. They had a variance between 49-173% of Matomo’s numbers that didn’t correlate with other sources of traffic.
So in theory, you could use this predictable variance as a modifier to Analytics data to calculate more accurate traffic stats. Compensating for GA4 inaccuracies.
In the end, none of these workarounds will ever give you perfect data. But is that really a problem?
What if you had perfect data?
Try this thought experiment: open GA4 and pretend for a moment that every number you see is 100% correct. Now proceed with your analysis.
Need ideas for analysis? Try answering these questions:
- What are your best performing traffic sources? (instructions)
- Which social networks send you the most engaged visitors? (instructions)
- Which content has rising/falling traffic from search? (instructions)
- Which email campaigns got the most engagement? (instructions)
- Where did your last article perform best? (instructions)
- How are visitors using your navigation? (instructions)
- Which PPC landing pages have the best/worst performance for mobile visitors? (instructions)
All done? How did it go? Now ask yourself: Do you really think the insights you found were better because of the data accuracy? Is the lack of GA4 accuracy really holding back your marketing? Be honest.
In my experience, the problem with Google Analytics isn’t accuracy. It’s that marketers don’t approach it consistently, with curiosity and with an eye toward action.
 |
Luke Szkudlarek, Growth Strategy Lead at what. AG, Zurich“Let’s stop talking about tools and start talking about data literacy, critical thinking and storytelling with data. Unfortunately, too few digital marketing professionals learn basic analysis and blindly trust digital analytics tools. Also the pressure from Google and Meta to spend more and from agencies profiting from big budgets creates a conflict of interest that isn’t in the interest of brands. My advice is to take part of your media budget and invest in your data literacy. Then build a simple, consistent approach to data collection, analysis and interpretation. This could be based on GA4 and Search Console or any other software. But analytics is essential for businesses that invest in Google Ads or SEO. Therefore it’s a smart choice to get your data to work for your business.” |
To get the most from your GA4 account, find those 10x performers and double down on those activities.
Find unicorns and make baby unicorns!
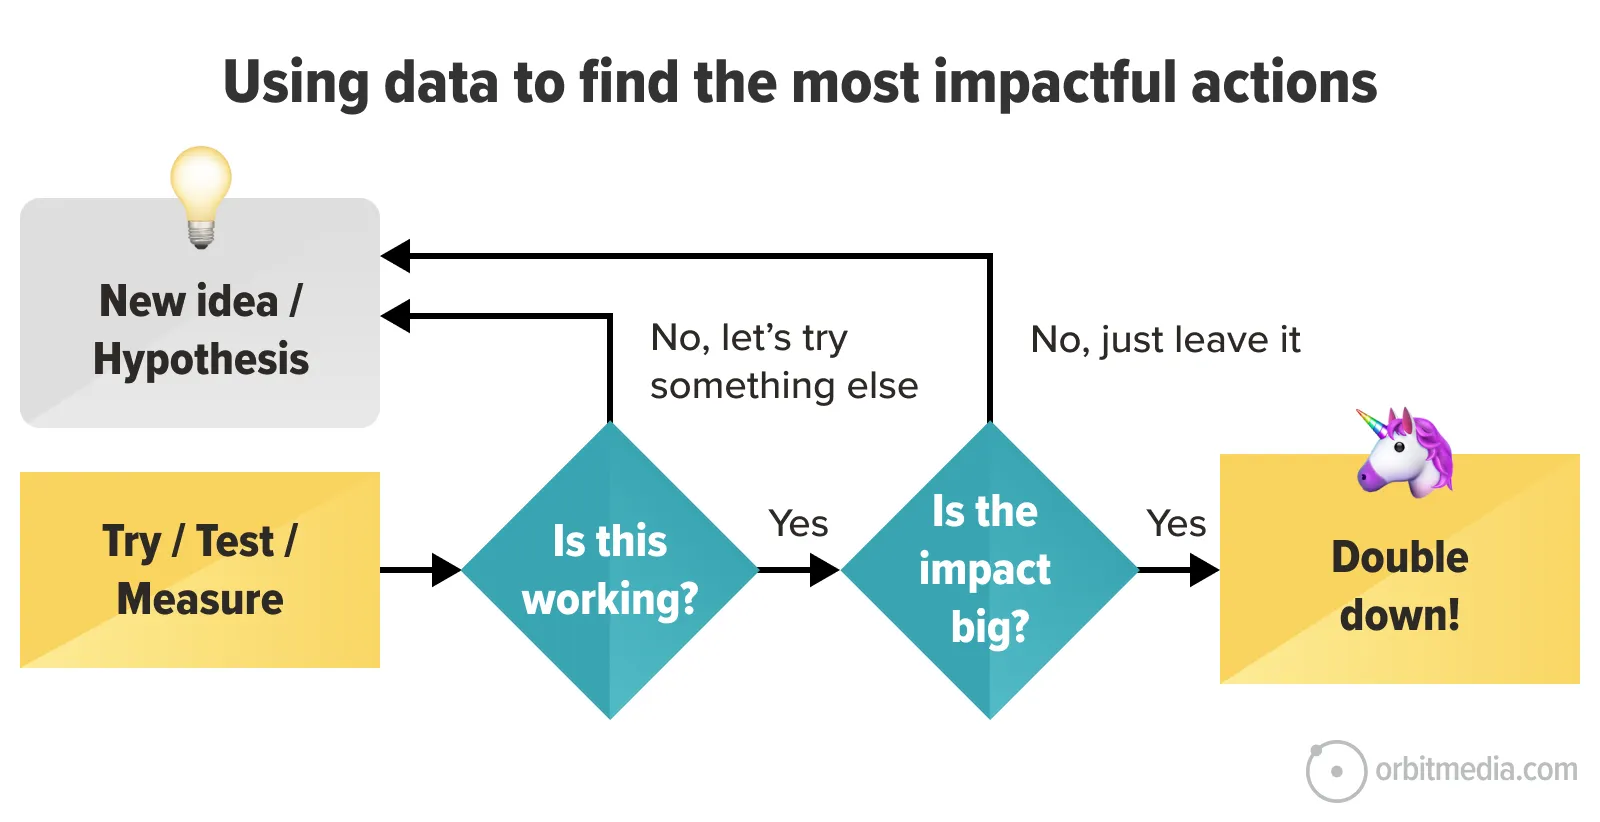
Image source: Data-Driven Empathy: How to Use Data in Marketing