Analytics is everyone’s job. It shouldn’t be delegated to one person or a separate team. Everyone in marketing needs to be able to see their results. And to find answers to questions about their audience.
In sports, there isn’t one player in charge of the scoreboard. Everyone can look up and see how the team is doing.
But the best teams collaborate. They make decisions together. They hold each other accountable. They coordinate their efforts. They win or lose together, as a team.
Here are the five tips for getting the most out of Google Analytics as a team.
Bonus! At the bottom of this post, we’ve got something extra for you: a sample agenda for great marketing meetings.
Tip #1: Give Access to Everyone! Adding Users in Google Analytics
First, we need to make sure everyone on the team can get in. Access can be granted at three different levels: Account, Property or View.
- Internal team members (employees) can be given access to the entire account, which automatically grants access to every property and every view. They will show up in the user management screen at every level.
- Third-party team members (marketing vendors or partners) can be given access to just the property or view relevant to them.
ProTip: See some old user accounts in Analytics? Delete them if they’re not on the team!
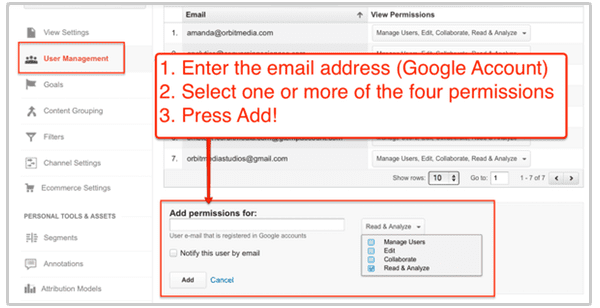
When adding an account, you can select one or more of four different permissions:
- Manage Users: In other words, do exactly what you’re doing now
- Edit: This permission grants the power over everything but users. That means creating or changing accounts, properties, views, filters, goals, etc.
- Collaborate: Ability to manage dashboards and annotations, plus see reports.
- Read & Analyze: Ability to see the reports, but do nothing else. Users with this access can create filters, segments, secondary dimensions, etc. But they can’t save or change anything.
The manager of the team needs the ability to manage users and edit accounts, properties and views. Internal and external team members need to collaborate, read and analyze.
Everyone on the roster? Great. Let’s start collaborating.
Tip #2: Add Annotations to Your Timelines
Ever look at Analytics, see a spike or a drop in traffic and wonder what happened on that day??
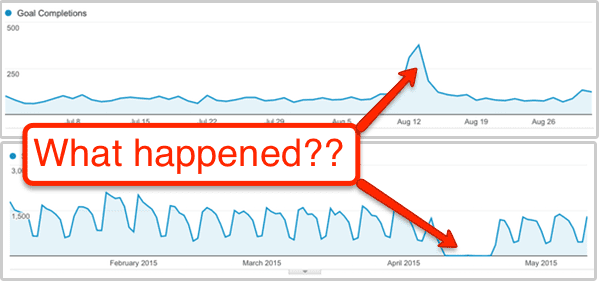
Did something go viral? Did the site go down? There’s a story here, but Analytics isn’t talking.
There’s a simple little way to add notes that tell the story. They’re called, “annotations.” They’re just tiny notes under your timeline.
Annotations are very important for teams because they tell everyone what happened on that day. Here are six good reasons to add annotations:
- A newsletter was sent
- You launched a major marketing campaign
- Something happened in the media, like a major press mention
- Advertising was turned on or off
- Something very bad happened (the site was hacked!)
- Major changes were made to the site (navigation was changed or the site was relaunched)
When adding annotations, it helps keeps things organized if you use a little naming convention. For example, start every newsletter annotation with “newsletter” This makes them more scannable.
Tip #3: Create and Share Dashboards
There are 100+ reports in Analytics. It’s easy to get lost. A quick way to help you and your teammates find things is to use dashboards.
A dashboard is just a combination of reports, all in one place. You can add timelines and tables from any report you’d like and share them with your team. Here’s how…
- Go to your favorite report (or any report that gave you an “A-ha!” moment)
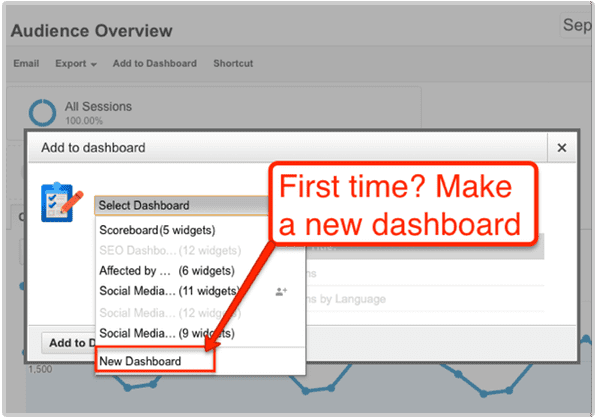
- Click the “Add to Dashboard” button at the top of the page
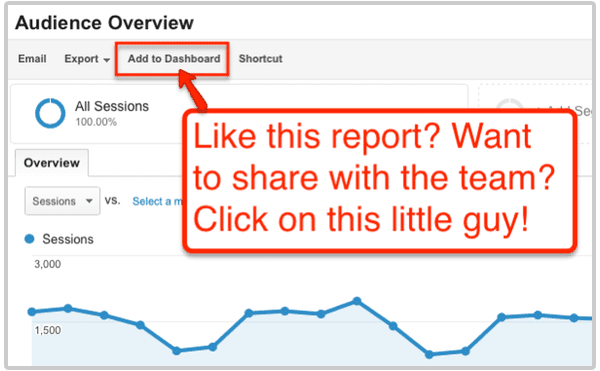
- You can add the report to an existing dashboard or create a new one. Give it a name that will inspire your team.
- Each table and timeline is added as a “widget.” Now that you’re in your new dashboard, you can add all kinds of different widgets in any layout you’d like.

- Finally, click share to make it public for your team!
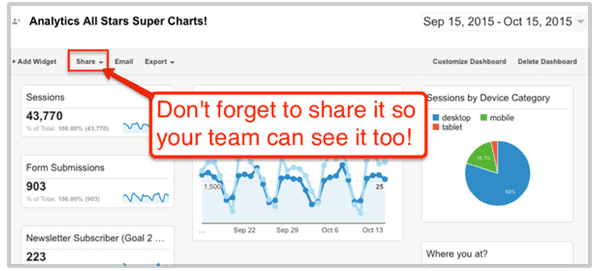
Bonus! See that little “Email” button next to the share button? Click this to automatically email your dashboard to anyone at any frequency. That’ll keep your boss off your back!
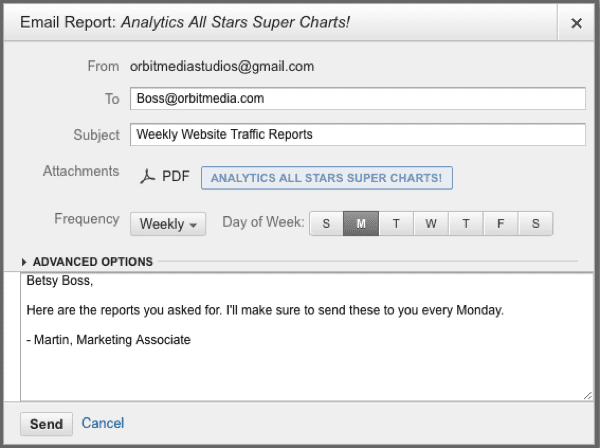
No time to “check Analytics?” No problem. Have your dashboard email itself to your inbox. Now Analytics is coming to you …life just got a little easier.
Tip #4: The Analytics Solutions Gallery – A Gold Mine for Collaboration
There’s a community of GA experts who create and share dashboards (as well as segments and custom reports) in the Google Analytics Solutions Gallery.
You can get to these right from the dashboards section. After clicking +New Dashboard, press the Import from Gallery button.
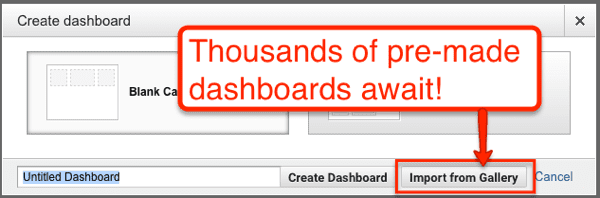
Now you have access to 12,000+ dashboards for social media, keywords, advertising and anything else you can imagine.
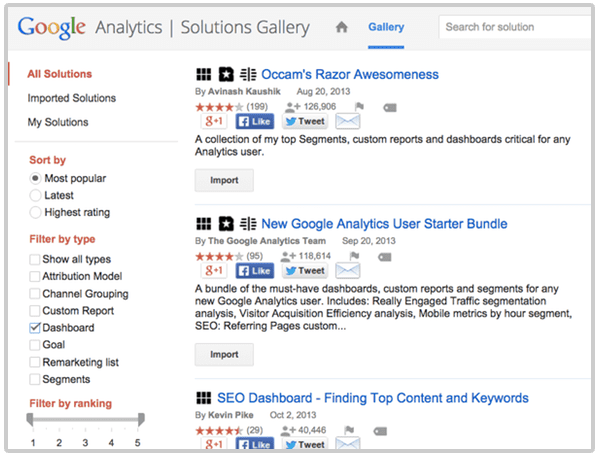
Find one you like? Add it to your Analytics with a single click on the “Import” button.
This kind of sharing is possible because all of the info about a dashboard can be contained in a single URL. So any dashboard you create can be easily shared just by emailing or posting a link.
Got a dashboard you’re proud of? Share it in the solutions gallery. Now, others can use it, review it and leave comments. It’s like having thousands of Analytics pros on your team.
Tip #5: Take (and share) Fast Screenshots of Any Report
Here’s a trick that I use every day. In fact, I’ve used it half a dozen times already while creating this post.
Instead of answering a question or making a point with words, do it with visuals. It just takes a second, and it makes a stronger point. Compare:
Text:
“Traffic from mobile devices went from zero to 50% over the last five years.”
Visual:
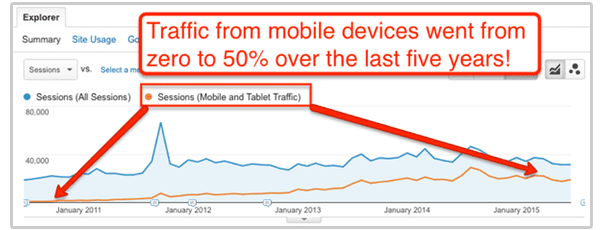
The visual is more convincing, more compelling.
A report is worth a thousand words. It’s also more credible and easy to make. Here’s a screenshot of me making that screenshot using a free tool called Jing.
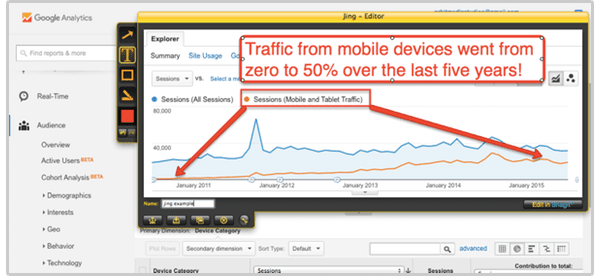
I added text, boxes and arrows with that little toolbar on the left. It took a total of seven clicks and a bit of typing.
Snagit ($49.99) and Sketch ($99) are other, more powerful tools for capturing and marking up screenshots.
The fastest way to make a screenshot of that Analytics report? Use the tools built into your computer. They don’t let you draw boxes and arrows, but they’re fast and free.
- Screenshots for Mac users
Press command + shift + 4 and turn the mouse cursor into cross hairs. Click and drag to select any part of your screen and it will save as a .jpg to your desktop. - Screenshots for PC users
Use the Snipping Tool to create a “snip” of any part of your screen or press alt + prt scr to create a screenshot of any window.
Bonus! Sample Marketing Meeting Agenda

Great meetings are well organized. Bad meetings are a waste of time. To make sure your marketing meetings are productive, use an agenda. And to make sure that you’re making good decisions as a team, build the Analytics collaboration into the meeting.
Here is a sample agenda for a 59-minute weekly marketing meeting. Items that involve Analytics collaboration are shown in blue.
0:00 – 0:10 Brief updates from teams
These might be individual people or entire departments. It could be the client and the vendor. It could be the social media community manager, the PPC partner, the freelance blogger and the marketing director.
- Any major issues?
- Any victories to celebrate?
- Report on the big picture? Review Dashboards
0:10 – 0:40 Review Current Activities
Take a close look at where your time, effort and budgets have been focused since the last meeting.
- What are the outcomes of the actions we are taking? Is it worth the time/cost? Reports and Analysis
- Should we adjust our approach? Need more time? Continue or discontinue that activity?
- Did everyone complete their action items from the last meeting? (accountability)
- Does anyone need help? Can anyone support anyone else’s efforts?
- Are we confident as a team that we’re going in the right direction?
0:40 – 0:55 Consider New Initiatives
Just knowing that there’s a time and place to bring up new ideas will keep people from distracting each other during the week.
- Anyone have any new ideas?
- Is there evidence that this effort will be worth the time/cost? Reports and Analysis
- Schedule more time to weigh pros/cons and then decide/delegate?
0:55 – 0:59 Action Items
Expectations for everyone should be crystal clear when they walk out of the room or hang up the phone.
- Who is going to do what before the next meeting?
Tip! For meetings at Orbit, we use Google Docs to manage agendas and take notes. It’s a place for everyone to add items at any time during the week, knowing that they’ll be addressed at the meeting. I put screenshots and questions into these meeting agendas all week long.
Tip! For remote meetings, use a free screensharing tool like Join.me to review those Analytics reports together.
Visibility is Accountability
Analytics is a way to discover the truth. It makes the outcomes of our actions visible, which means we can hold our teams, our budgets and ourselves accountable for our marketing efforts.
But beware, the pretty charts in Analytics don’t actually affect our marketing. Only actions affect outcomes. So get together with your team, ask questions, find answers, and work together to drive measurable results.
“Creatrix victoriam per consortium” were the famous words spoken by Julius Caesar, upon uniting the ancient world into a single empire. [citation needed] The translation from Latin applies to marketing teams today…
Creative victory through collaboration.