It’s such a common question, some Analytics pros are tired of hearing it. When the boss or a client asks “What’s a good bounce rate?” or “What’s the average bounce rate?” they groan and the responses get snarky.
A bounce rate is basically a one-page visit but no one likes one-page visits. Everyone wants to lower their bounce rate. But what is an acceptable bounce rate? We’re going to answer this question once and for all.
We have access to hundreds of Analytics accounts across a huge range of industries. So we looked at 501 Analytics accounts, calculated the average bounce rate by industry and traffic source, to create a better bounce rate benchmark.
We’ve seen articles that calculate average bounce rate from a few dozen accounts, but this larger study should be more accurate and useful.
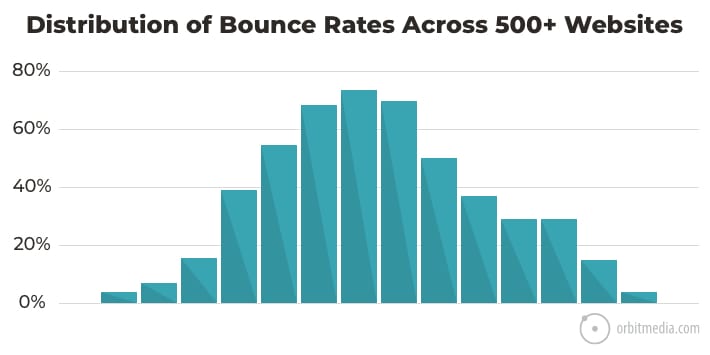
The average bounce rate for websites is 61%
Actually, it was 60.99%, but close enough. Here you can see the distribution curve for those sites. Half of all the accounts had bounce rates between 50-70%
Now we’ll break it down for traffic sources, for industries, for ecommerce. Finally, we’ll look at the reasons bounce rates are so high and how to lower them.
Average bounce rate by traffic source
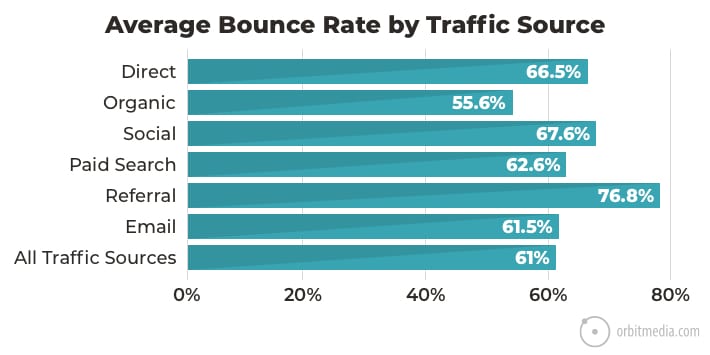
Some traffic sources have higher bounce rates than others. Here you can see the variance:
Direct Traffic Bounce Rates
These visitors bounce at an average rate of 66.5% which isn’t surprising. Most of these visitors are brand aware. They’re more likely to be repeat visitors. They might even be jumping back into a page in their browsing history.
Organic Search and Social Media Bounce Rates
- The average bounce rate for organic visitors is 55.6%
- The average bounce rate for social media visitors is 67.6%
Social visitors are more likely to bounce than organic visitors. Why? Because engagement correlates with intent. If you really want an answer, if you took the time to search for it, if you typed it on a keyboard, you’re more likely to spend more time and visit more pages.
- Visitors from search typed
They tend to have stronger intent. They have specific information needs. They’re busy. - Visitors from social tapped
They were browsing and less likely doing research. They were killing time. They’re bored.
The differences between search and social visitors are fascinating. And it’s an important topic for content strategists. For a summary of those differences, see our search v. social breakdown.
Paid Search Bounce Rates
The average bounce rate for paid traffic is 62.6%. This is the only number in the report that worries me, because it represents the failure rate of advertising. These are the most costly visitors. Each bounce is an investment without immediate return.
 |
Dan Kipp, analytics lead, MARCEL DIGITAL“I view paid search as two categories; paid search non-brand and paid search branded. Costs, conversions, competition, and even bounce rate will vary drastically from one to the other. We’ve learned it requires careful segmentation of keywords and understanding of campaign goals to determine what bounce rate is right or wrong for your paid campaigns.” |
Email Bounce Rates
The email bounce rate benchmark is 61.5%, very close to the overall average. But bounce rates for email visitors varied a lot from site to site (some were very high, some very low). Apparently, some email landing pages are much more engaging than others.
Average website bounce rate by industry
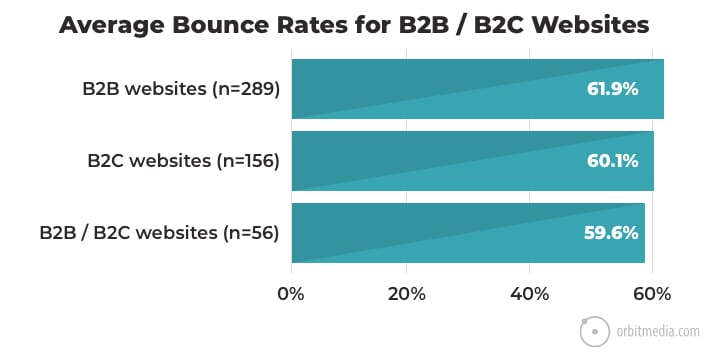
There is surprisingly little variance across websites with B2C and B2B audiences.
Next, we’ll look at bounce rates across various industries. Industries for which there were fewer than ten websites in the dataset were excluded from this analysis.
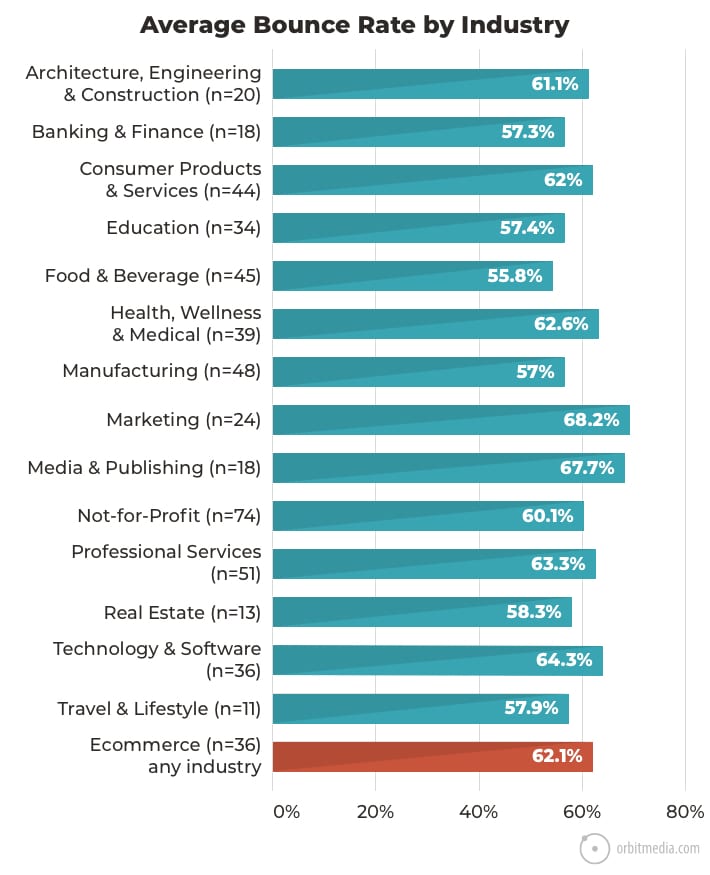
Here again, there isn’t a ton of variance. Each industry falls within the range of 55% to 68%.
Ecommerce Bounce Rates
36 of the websites in the dataset were ecommerce websites. They overlap with several of these industries. Some were B2B, some were B2C. Some were high traffic, some low. The average bounce rate for all of these ecommerce sites was just slightly higher than the average for all websites.
The average bounce rate for ecommerce websites is 62.1%
Bounce Rates for blogs and media websites
The Media & Publishing category has one of the highest bounce rates: almost 68%. That’s because visitors to articles typically have information intent. They came for the topic and often leave after reading that one page.
Although it’s not separated in the data, we know from experience that websites with mature content programs have higher bounce rates. The average bounce rate for a blog section is higher than the numbers above.
The bounce rate for this blog is 86%. But we’re just glad you’re here!
The two industries with low bounce rates: banking and beverages
These two industries have some of the lowest bounce rates, but it’s not because of the industry. It’s because of website features and requirements.
- Bank websites (or any website with a popular login area)
- Alcohol websites (or any website where visitors must specify their age before getting in)
Bounce rates aren’t lower because of design or content. They’re lower for functional UX reasons. Almost all visitors get to a second page because the first page was just a speed bump.
How to improve bounce rate accuracy for these sites?
If your site has a popular login area, create a segment to remove all those current customers who go straight to the sign-in page.
Here’s one I made that removes the visits that included a view of the login page. You can see it’s about two thirds of the traffic!

If the login is right on the home page (no separate login page) then you’ll need to create an event on that click, and then have the segment exclude visitors who triggered that event.
Other reasons bounce rates may be very low
If your site has a low bounce rate that isn’t explained by website features or UX, maybe your Google Analytics is inaccurate. It could be one of these reasons:
You have duplicate Analytics code
Why is my bounce rate 1%? If your bounce rate is in the single digits, it’s probably because you have Analytics tracking code on your website twice. Often it’s once in the code and again in the Google Tag Manager container.
The fix: Remove the second instance of your Analytics Javascript tracking code.
Events are deflating your bounce rate
If you have event tracking set up, they may be affecting your bounce rate. This is because a bounce is technically a one-hit visit, not a one-page visit. And events are hits!
The fix: Go into Google Tag Manager. In the tag, set “Non-Interaction Hit” to true and the event won’t affect your bounce rate.
Why are all of these bounce rates so high?
Surprised by the numbers in this report? I am not. The one-page visit is just the reality of the internet. There are all kinds of visits that record as a bounce in Analytics.
- We leave tabs open in our browsers for days (touch that tab and a bounce is recorded)
- We go to a page in our browsing history to get quick information and then leave
- We go to a page that is loading slowly, we close the tab before it finishes
- We land on a page, read deeply for several long minutes, then hit the back button
Every day, we go to websites, decide they are irrelevant, ugly or useless at the time, and leave without clicking. Look at your own browsing history. It’s likely that you bounce from 60% of the sites you visit.
60% is an acceptable overall bounce rate.
What do I do next?
You have the benchmark. Go compare your metrics to those in this report. Check the overall bounce rate, but then look closer at the bounce rate for various traffic sources. The start asking questions:
- Do you have a 1% or 100% bounce rate? If so, there’s something wrong with Analytics.
- Is your bounce rate below 40%? If so, check to see if events tracking is affecting your bounce rate. If so, it’s not necessarily a problem, but it means you shouldn’t compare to the benchmarks here.
- Is there enough traffic in each traffic source to trust the number? If not, ignore it.
- Is a lot of the traffic within a high bounce rate traffic source to a small group of URLs? If so, look at the bounce rate for those pages. Look at the content. Consider the visitor intent. Is there a problem or an opportunity?
- Is the bounce rate for paid traffic above 60%? Check your ads or call your PPC vendor right away!
- Don’t panic. It’s not the most important metric in Analytics…
 |
brad smith, co-Founder, USERP“Bounce rates are highly subjective. Page-level bounce rates are good. Exit rates are better. They all get you one step closer to assessing that one simple thing: Do peeps like what they see? If they don’t, they leave. No sale. If they do, they stay and come back. Revenue goes up and to the right. Bounce rates aren’t the end-all, be-all metric. They’re one simple way to see if you’re trending in the right direction.” |
The analysis is done. Now get to work!
We must never stop improving our websites and giving our visitors better, more engaging experiences. Keep these bounce rate benchmarks in mind, and get to work bringing them down.
Here are five ways to reduce your bounce rate:
- Improve click through rates by leveraging your highest CTR headlines
- Use formatting for scan-ability
- Make your content more visual with images, graphs and videos
- Remove dates from your blog
- Increase traffic from low-bounce traffic
For a more detailed explanation of each of these ideas, see the original post that explains how to reduce your bounce rate. It has a lot more information and tips.
About the data
There are 250M+ website visits in this dataset. The sites range from 10M+ to 10K visitors per year, enterprise to small business. 95% of them are US companies. Data was collected in February of 2020.
58% were B2B, 31% were B2C and 11% were websites that target both consumers and businesses, such as bank websites.
Filtered views were used when available. We removed outliers with ultra-low bounce rates (for reasons mentioned above) and ultra-high bounce rates (those weird, one-page websites). We also ignored bounce rates from any traffic source that had less than 200 visits.
The 501 accounts were from friends, clients and partners. Quick shoutout to collaborators…
- Big thanks to Marcel Digital for being our data partner. It’s appreciated!
- Big thanks to Emilee Joseph from Don’t Panic Management for the data collection help.
- Big thanks to Amanda and Jantzen for helping with the charts and data
People share access to their Google Analytics with us all the time. It brings them good luck!

