Social media management is hard work.
It takes a lot of time and energy. Connect and share. Listen and engage. Grow your following. Be consistent.
Usually the list of social media marketing goals includes “brand awareness” and “drive website traffic.” But how well is working? What social media channel is bringing visitors to the site? What are they doing? Not long after you start sharing content on social media, you find yourself asking this question:
“How do I track social media in Google Analytics?”
Of course, there are all kinds of social media metrics right in front of you. There are likes, shares, comments and followers. It’s a data-rich channel with tons of social media analytics tools. But these numbers don’t necessarily translate into website engagement.
In fact, these are the content marketing metrics least likely to correlate with business outcomes.
This post shows the step-by-step process for answering each of these questions using GA4.
- How much traffic is social media bringing to your site?
- How does social media traffic compare to other traffic sources?
- Which specific social media channels are sending the most traffic? The best traffic?
- Which blog posts are getting the most traffic from social media?
- Which social media campaigns are attracting and converting visitors?
- How is paid social traffic different from organic social traffic?
- How is social traffic different for mobile and desktop visitors?
How much social media traffic are we getting?
How does social media traffic compare to other traffic sources?
Acquisition > Traffic acquisition report, set to “Default channel groups”
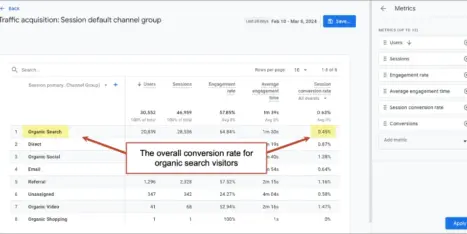
We’ll start with two big picture questions. They’re easy to answer and the insights are good. Here’s how to see the top-line traffic from social media relative to your other traffic sources using some of the most useful metrics in Analytics.
We’ll use the Traffic acquisition report, where “Organic social” is one of the “Default channel groups.” Along with Direct, Organic Search, Referral and Email, it’s one of the big buckets of traffic sources.
- From the Reports section go to Acquisition > Traffic acquisition
- Click the pencil icon in the top right to Customize the report. Some options will slide in from the right.
- Click on “Metrics >” and select your favorite metrics, or use my recommendations: Users, Sessions, Engagement rate, Session conversion rate, Average engagement time per session, Event count and Conversions.
I think those are the best. I’ll come back to those throughout this post. Here’s what the customization looks like.
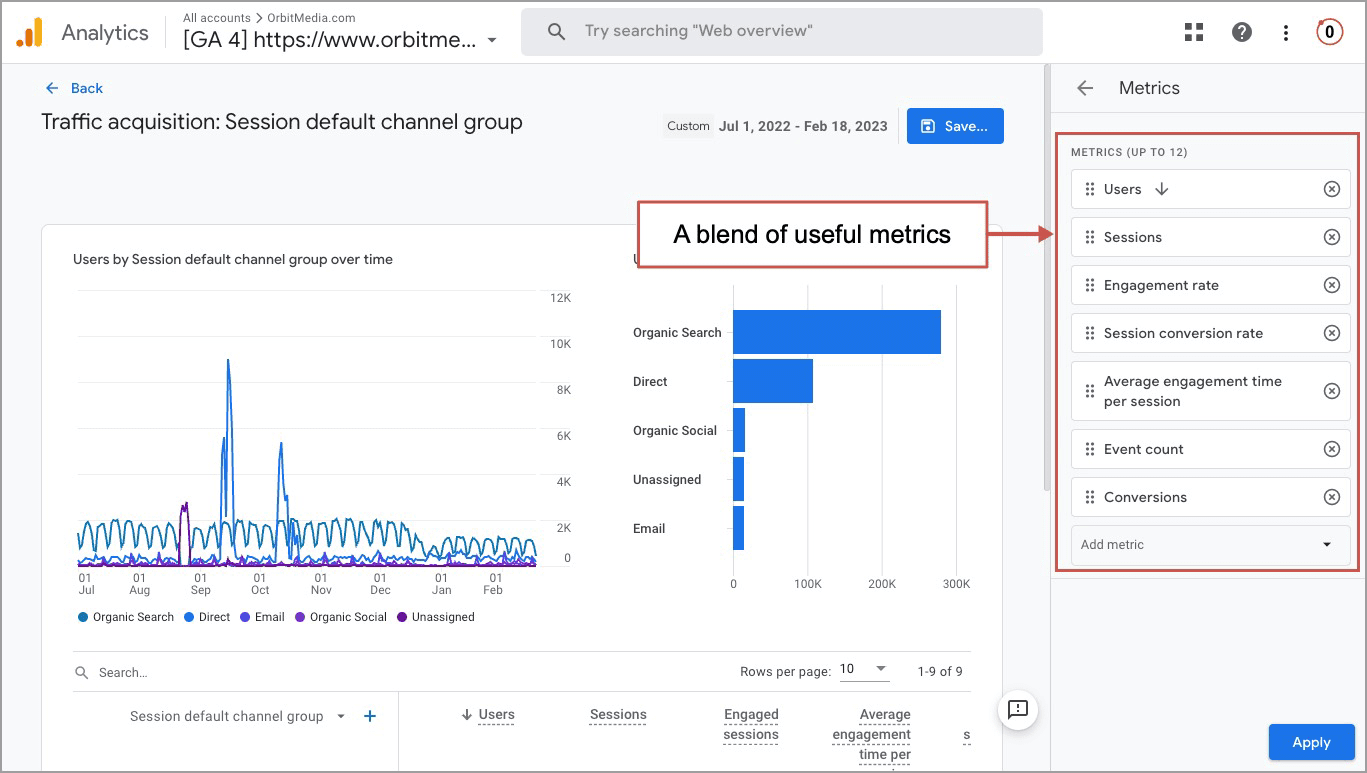
- Click “Apply” in the bottom right
- Save (Save changes to the current report), then hit “← Back” in the top left to go back to the newly customized report
Now you are measuring social media traffic, engagement and conversions. You can see how it compares with the other traffic sources.
- How much traffic are we attracting from social media? (users, sessions)
- How engaged are visitors from social media? (engagement rate, avg engagement time)
- How likely are social media visitors to take action? (session conversion rate, conversions)
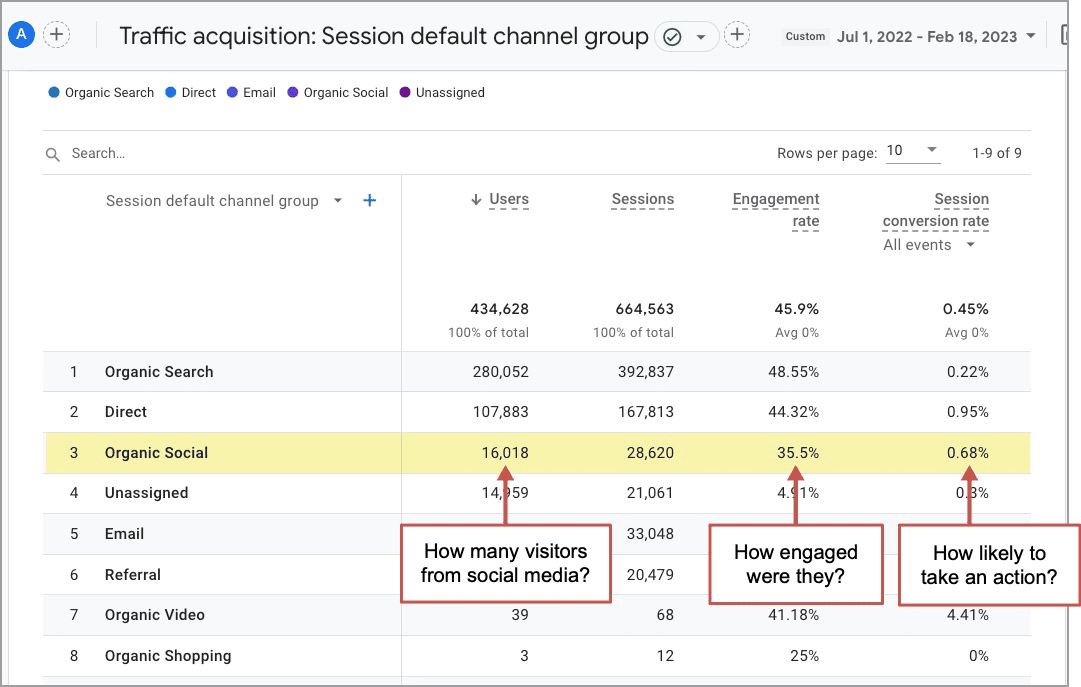
In this account, I’m only seeing organic social media since there is no paid social media traffic.
When I scroll to the right to see conversions, I can select any goal from the drop down. It looks like over the last 6 months, I can credit social media with 370 email subscribers but just four contact form submissions. Connecting conversion to traffic sources is called “attribution.”
Don’t be surprised if…
- Conversion rates for visitors from social media are lower than those of the other traffic sources. Social media visitors tend to have lower intent than search or direct visitors.
- The numbers may be very low. If so, just set a bigger date range. Beware of seasonality and changes in marketing activity.
Related: Here’s our guide to website traffic sources if you want the detailed (sometimes surprising) definition of all 18 Default Channel Groups in GA4.
Which social channels are sending us the most traffic? The best traffic?
Acquisition > Traffic acquisition report, set to “source” and filtered for social.
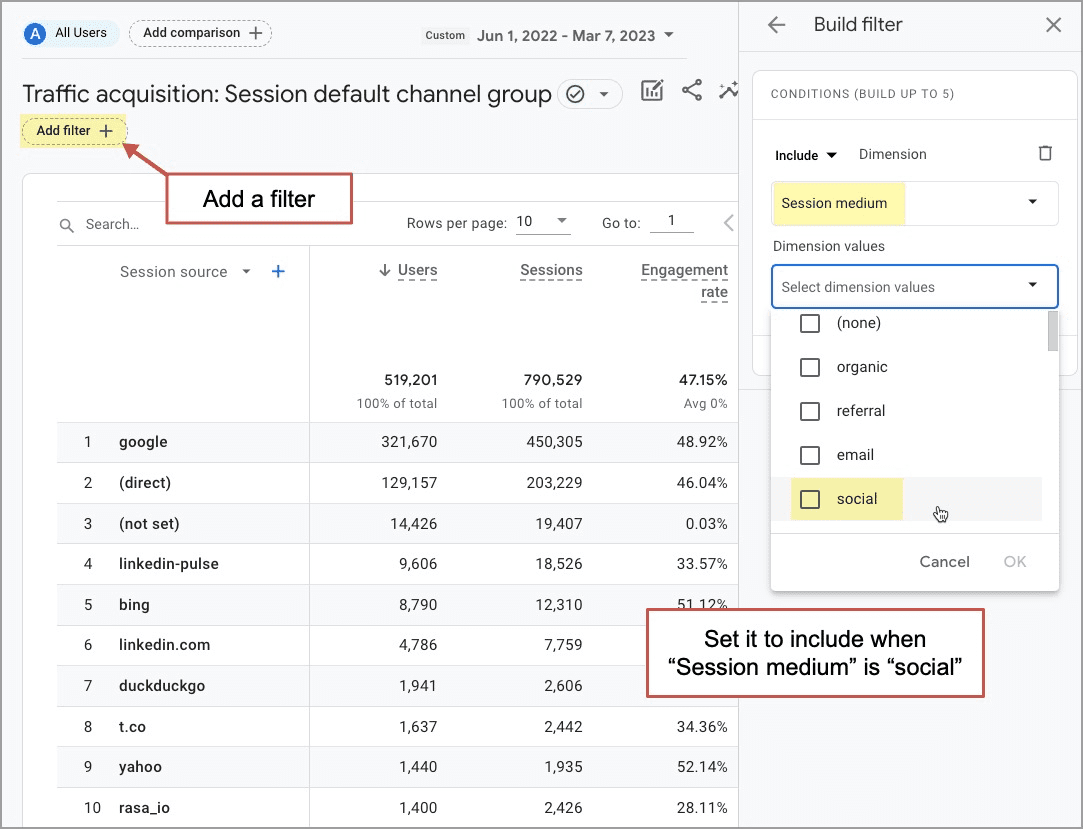
We can do this from the same report. Just change the dimension in the dropdown above the first column. Switch it from “Default channel group” to “Source.” Then you can create a filter to show just traffic from the “social” medium.
Here’s the full process:
- From the Reports section go to Acquisition > Traffic acquisition
- Click the pencil icon in the top right to Customize the report. Some options will slide in from the right.
- Click on “Metrics >” and select your favorite metrics, or use my recommendations: Users, Sessions, Engagement rate, Session conversion rate, Average engagement time per session, Event count and Conversions. (see the screenshot above)
- Click “Apply” in the bottom right
- Save (Save changes to the current report), then hit “← Back” in the top left to go back to the newly customized report
- In the dropdown above the first column, change the dimension from “Default channel group” to “Source”
- Click “Add filter +” and set the filter to include traffic when the “Session medium” is “social”
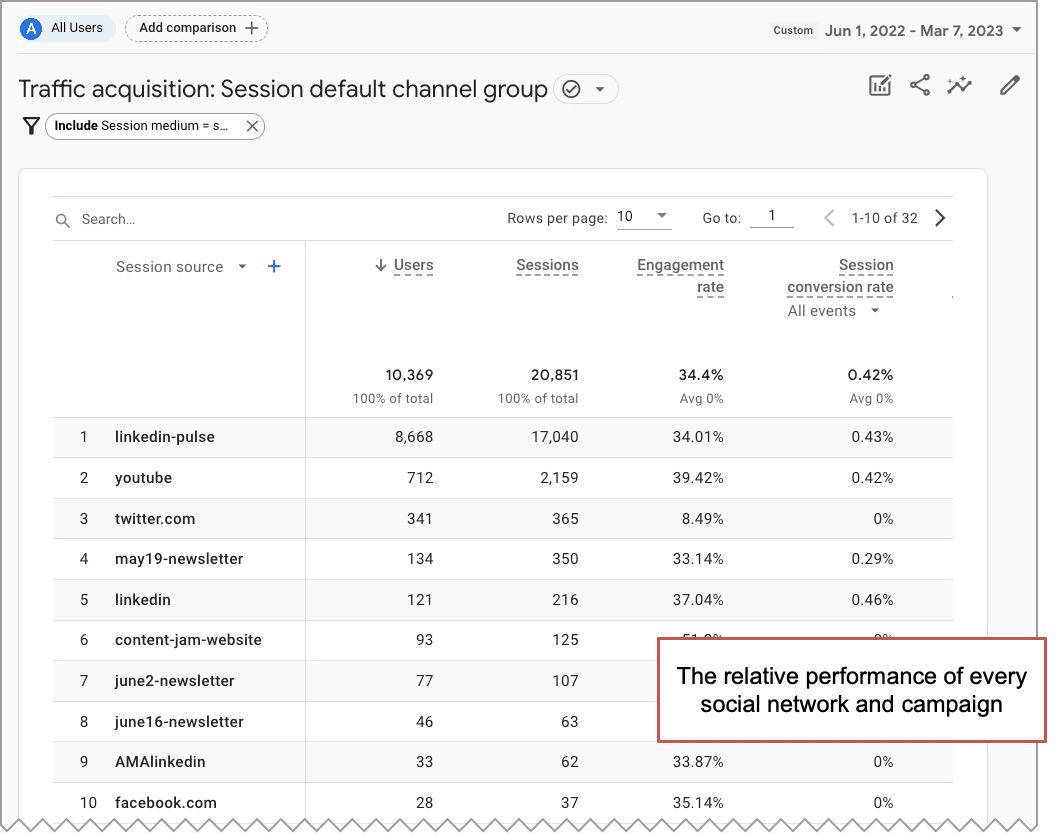
Now you’re looking at a list of social traffic sources, including social channels and campaigns tagged as social. It’s easy to compare these social traffic sources at a glance.
- Which are attracting more visitors? Notice how some attract a lot more traffic than others.
- Which are attracting more engaged visitors? Notice how some have higher engagement and conversion rates than others?
Don’t be surprised if…
- You may see surprise traffic from social networks where you aren’t even active. Those networks may not be part of your strategy, but they still contain links to your site.
- Instagram doesn’t bring in much traffic, but those visitors are highly engaged.
- Pinterest is a surprisingly good source of traffic!
Which blog posts are getting the most traffic from social media?
Engagement > Pages and screens report, set to “Page path” and filtered for social.
We covered this in our Content Marketing Audit for GA4, which shows how to measure content performance in all three of the main channels: SEO, social media and email marketing. Let’s review the process for measuring content marketing performance in social media using GA4.
Because we’re looking at specific pages, we’ll use an Engagement report rather than an Acquisition report.
- Go to the Engagement > Pages and screens report
- Click the “Add Filter +” so we can see just the social traffic
- Set the Dimension to “Session medium”
- Set the Dimension value to “social”
- Click “OK”
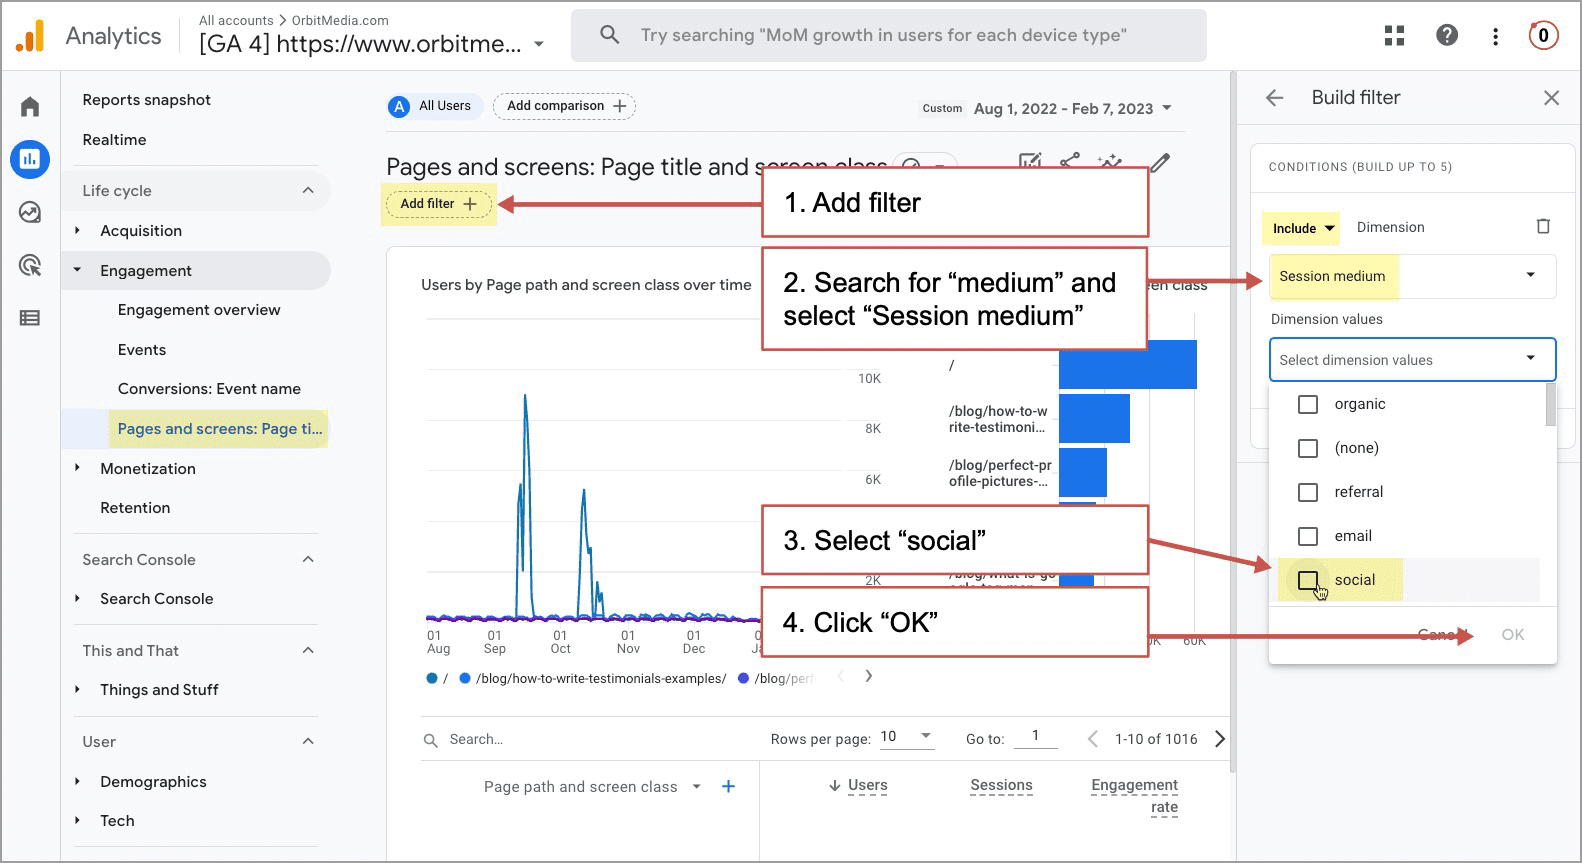
- Type “blog” into the search box to see just the URLs from that directory.
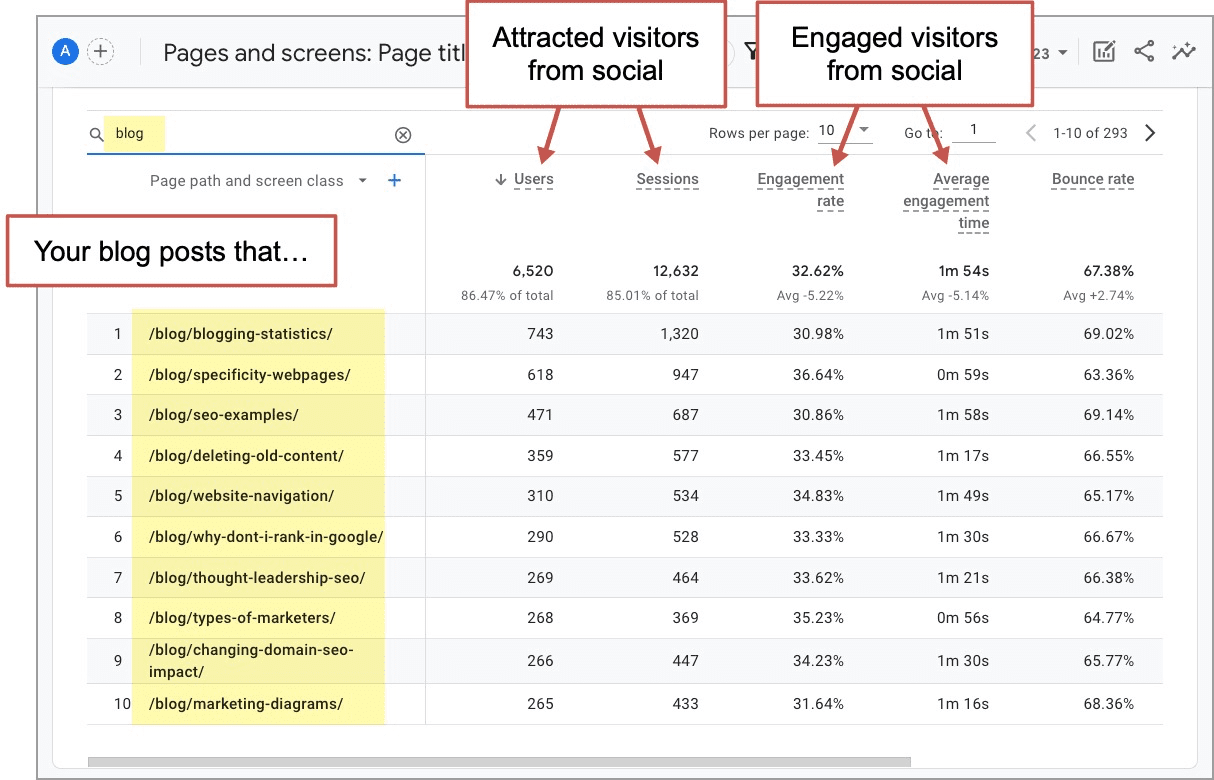
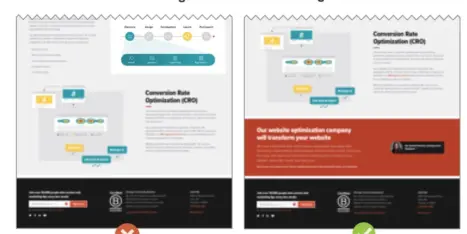
Analyze those top performers, looking closely at the headlines, formatting and visuals. What do they have in common?
Don’t be surprised if…
- Some articles do much better in social media than others. In the example above, it’s immediately clear that articles with lots of visuals had the best social media performance.
- Articles that weren’t on your radar are suddenly doing well. All it takes is for one influencer to post one link and you may see a spike in traffic.
Which social media campaigns are attracting and converting visitors?
Acquisition > Traffic acquisition report, set to “Session campaign”
Some marketing efforts are worth tracking separately. For example:
- Traffic from a paid social campaign (Facebook ad campaign, sponsored posts, etc.)
- Traffic from a social media video
- Traffic from a collaboration with an influencer
In Google Analytics, a campaign visit is any visit from a link that has campaign tracking code, which are those little UTM parameters added using a Campaign URL Builder. If you haven’t done this before, we’ve added a step-by-step process at the bottom of this article.
When Analytics sees these in the link, it attributes the session to that campaign. This is how you can track which specific social media efforts led to which outcomes. 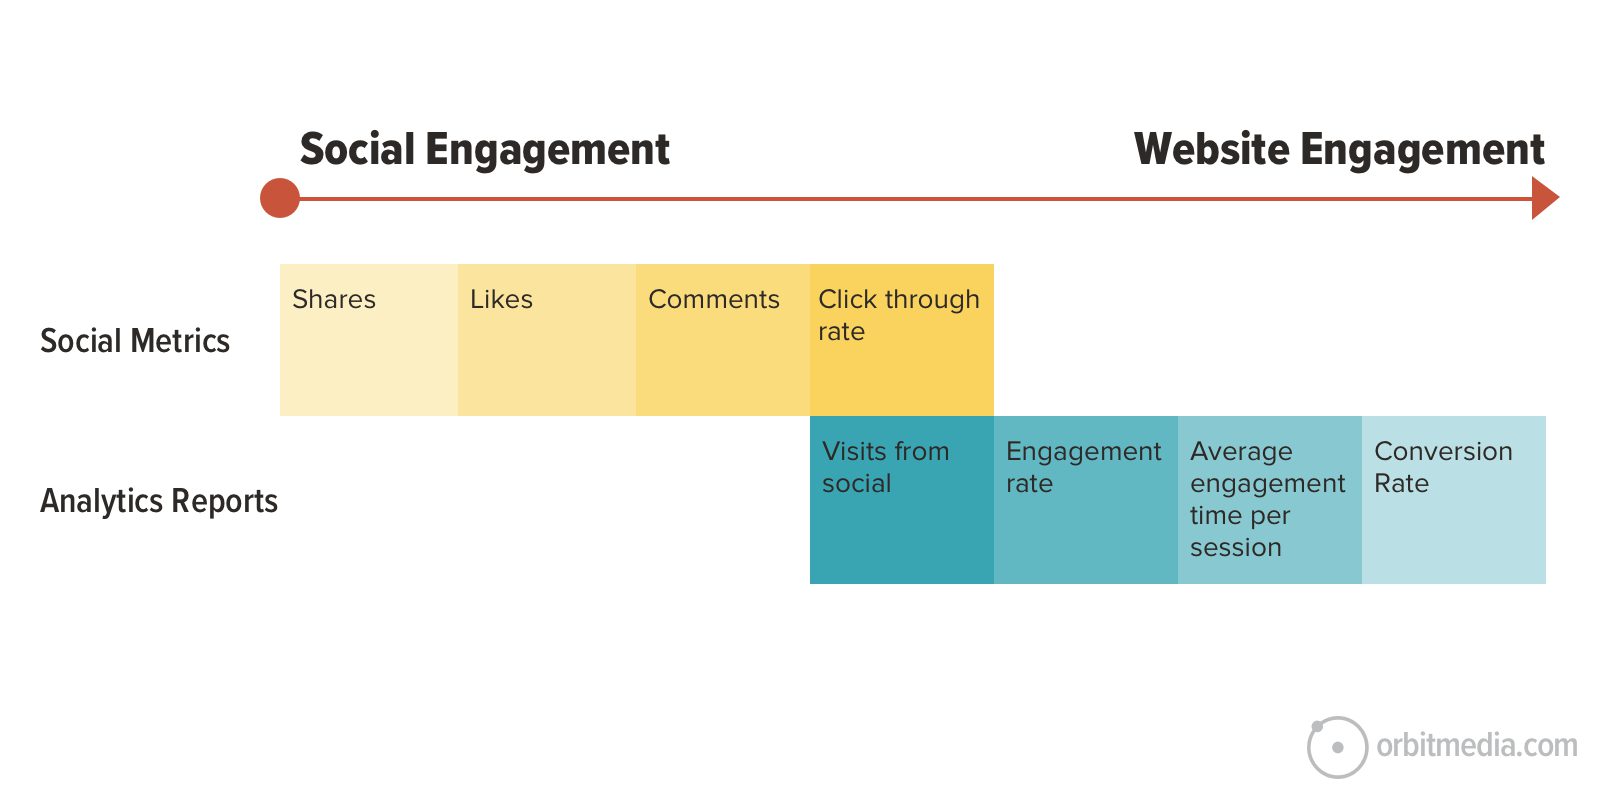 Without campaign tracking codes, Analytics will do its best, but it won’t show which specific campaigns had what kinds of traffic, engagement rates and conversion rates. So tag the links in your social campaigns.
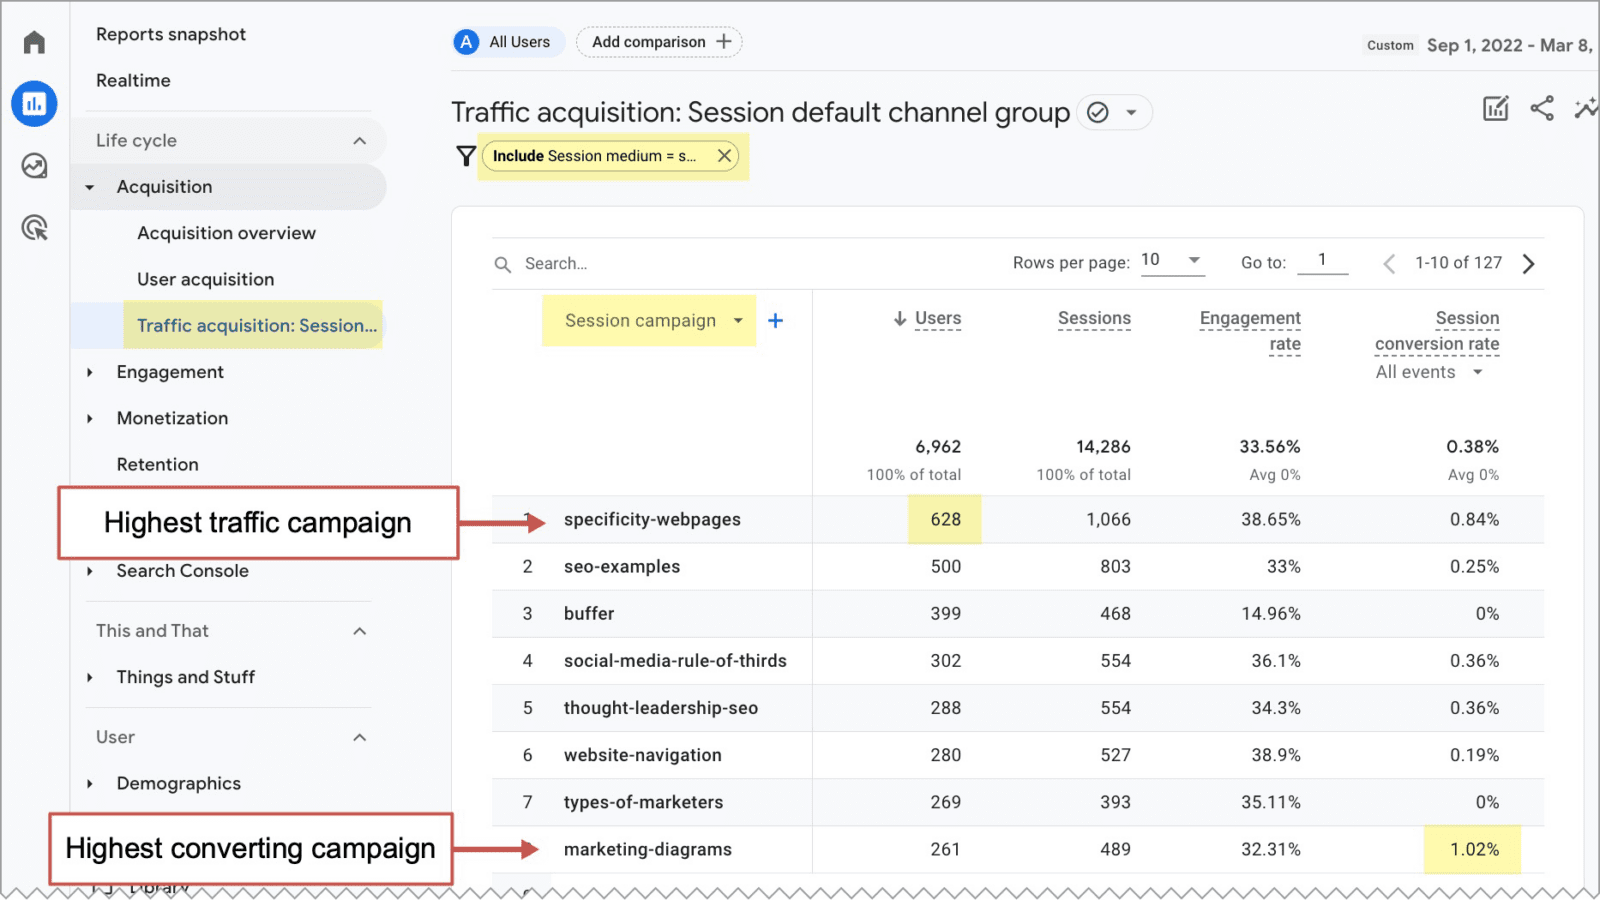
Here’s how to see the performance of your social media marketing campaigns, paid and organic:
- Go to the Acquisition > Traffic acquisition report
- Customize the report if you’d like, using the metrics recommended above (sessions, engagement rate, conversion rate, etc.)
- In the dropdown above the first column, change the dimension from “Default channel group” to “Campaign source”
- Click the “Add Filter +” so we can see just the social traffic
- Set the Dimension to “Session medium”
- Set the Dimension value to “social”
- Click “OK”
 Don’t be surprised if…
- The lifespan of that link is longer than expected. A single social post can drive traffic for a week or more, with expanded reach and life for each social share.
- Conversion rates are zero? It’s hard to get any visitors (especially visitors from social media) to take action. When traffic is there but conversion rates are low, work harder on your calls to action.
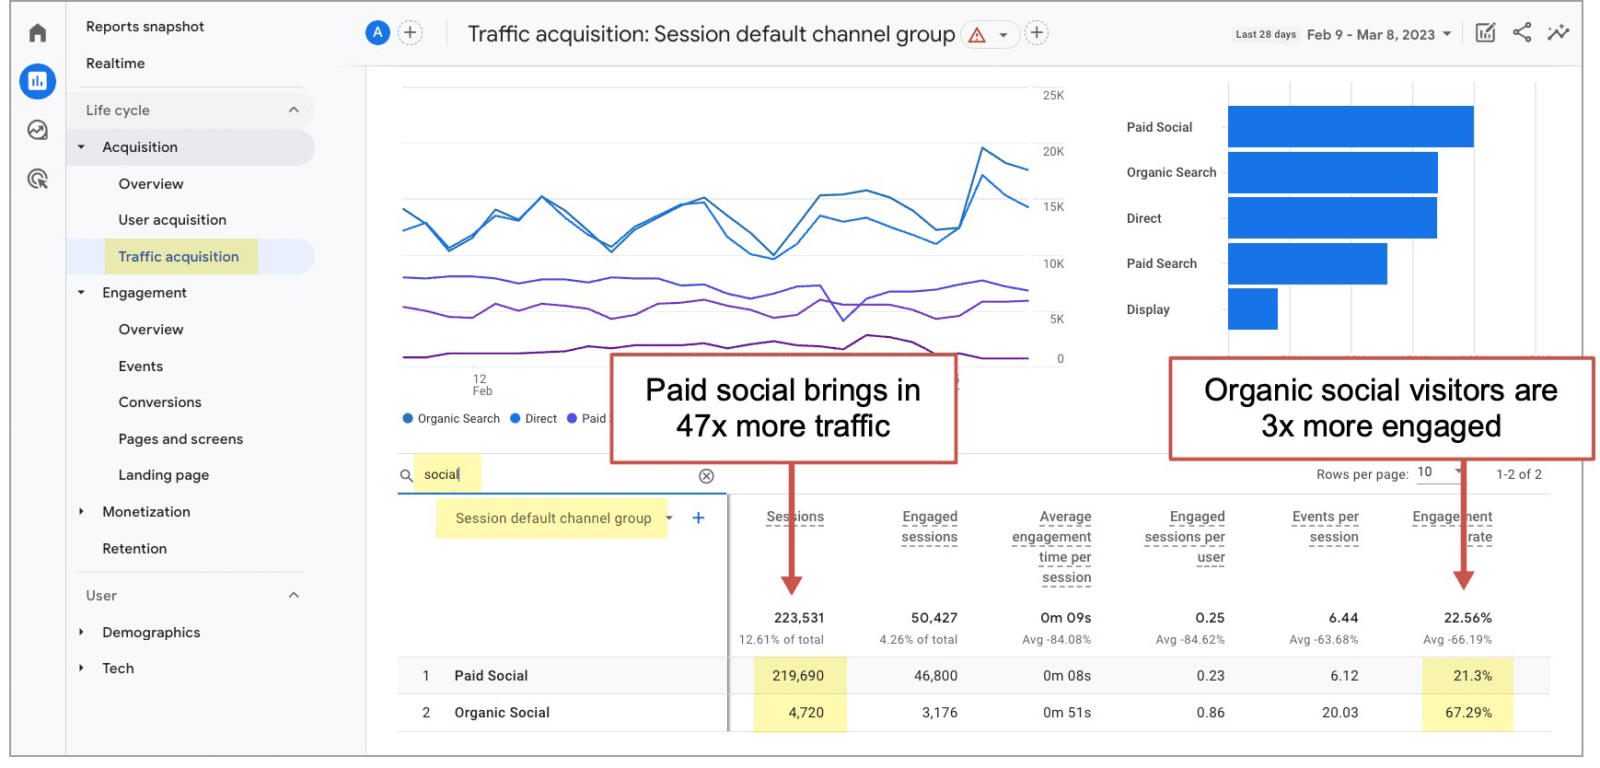
How is paid social traffic different from organic social traffic?
Acquisition > Traffic acquisition report, set to “Default channel groups”
This is actually much easier in GA4 than in Universal Analytics because there are two separate default channel groups for social: Organic social and paid social.
You can see the difference in performance for these channels in just a few clicks.
- From the Reports section go to Acquisition > Traffic acquisition
- Customize the report if you’d like, using the metrics recommended above (sessions, engagement rate, conversion rate, etc.)
- Enter “social” into the search box above the first column
That’s it! Three clicks and few keystrokes. You’ll immediately see how your campaigns are performing.
 Don’t be surprised if…
- Engagement for paid social is relatively low. These are low-intent visitors who tapped on an ad while browsing through a social stream.
We asked a friend and social media marketing expert, Anne Popolizio, for her input on the differences between paid social and organic social traffic sources.
 |
Anne Popolizio, Social Squib“As the data about shows, paid social will drive vastly more traffic and the engagement rate will be lower than organic traffic. The reason for this discrepancy comes down to the audience’s relationship with you. Organic social’s primary job is nurture. Organic is where you can have a meaningful, relationship-building conversation over time. On platforms like Instagram and TikTok, it’s very difficult to go from a piece of organic content to a website. Your audience has to jump through a few hoops. So someone who makes it to your website from organic social is 1. extremely warm and 2. really determined. Paid social, on the other hand, is your strongest audience-growth tool. It’s the most effective marketing tool for building retargetable audiences and doing top-of-funnel conversion, like email list growth. But because this audience doesn’t know you, they are likely to not spend 2:50 seconds on your site. That comes 12 touches later. Next, we’ll go deeper into the differences between paid social and organic social by adding mobile vs. desktop data, answering an even more interesting question…” |
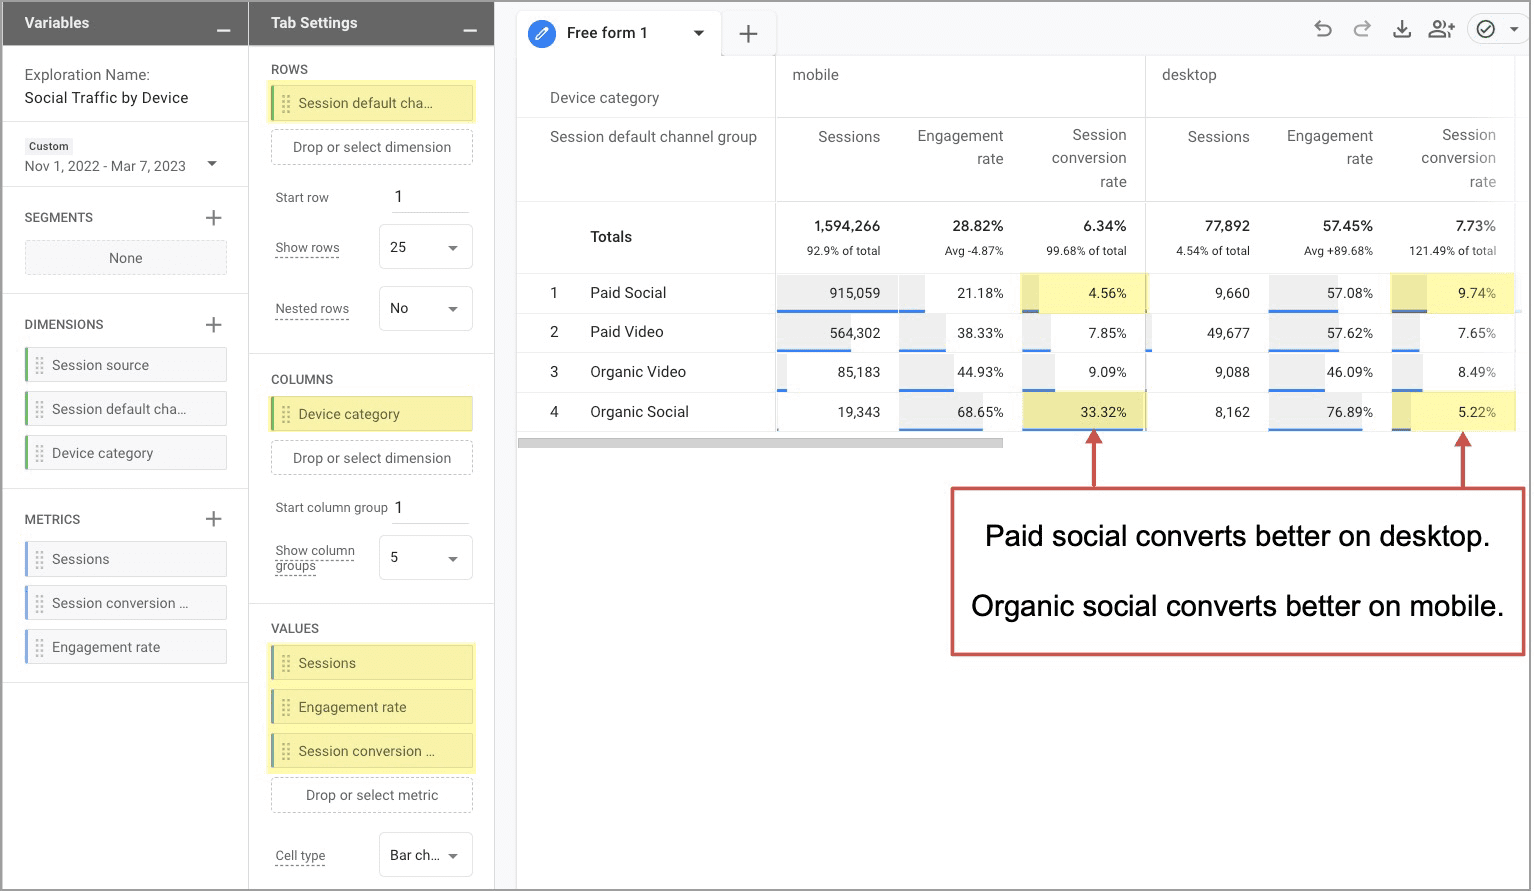
How is social traffic different for mobile and desktop visitors?
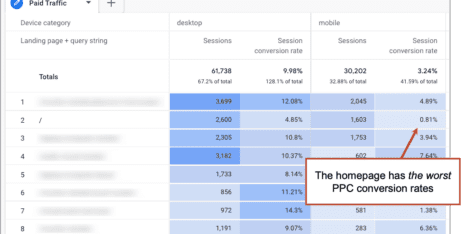
Blank Exploration with “Default channel group” as the rows. “Sessions” “Engagement rate” and “Conversion rate” as the values. “Device category” as the columns.
For this, we’ll use an Exploration. We’ll build the exploration from scratch, using dimensions and metrics as our rows, values and columns.
- Click on “Explorations” and select “Blank”
- In the first column, let’s add some variables. Start by clicking the plus sign next to DIMENSIONS and then searching for and selecting “Session default channel group” and “Device category.”
- Next we’ll click the plus sign next to METRICS and add “Sessions” “Engagement rate” and “Session conversion rate”
- Drag the “Session default channel” dimension into the ROWS box in the Tab Settings column
- Drag your three metrics into the VALUES box.
- Drag the “Device category” dimension into the COLUMNS box.
To clean up the report you can right click on any of the channels and “exclude selection” removing it from the report. Here I’ve removed all but the social and video channel groups.
How to create a social media segment in GA4
Blank Exploration with “Paid Social” and “Organic Social” segments. “Cities” are the rows and “Sessions” and “Conversion rate” are the values.
In Universal Analytics, segments were in every report, right at the top. GA4 segments are only for explorations, but they work the same way. You can use segments to compare various audiences based on behaviors and traffic patterns. Here’s an example:
Suppose we’re a business with physical locations in many cities and we do paid social media campaigns in those markets. We want to know the traffic and conversion rates for paid social traffic in each city. And we’d like to compare this to organic social traffic.
We’ll do this using an Exploration with two segments, one for paid social and one for organic social.
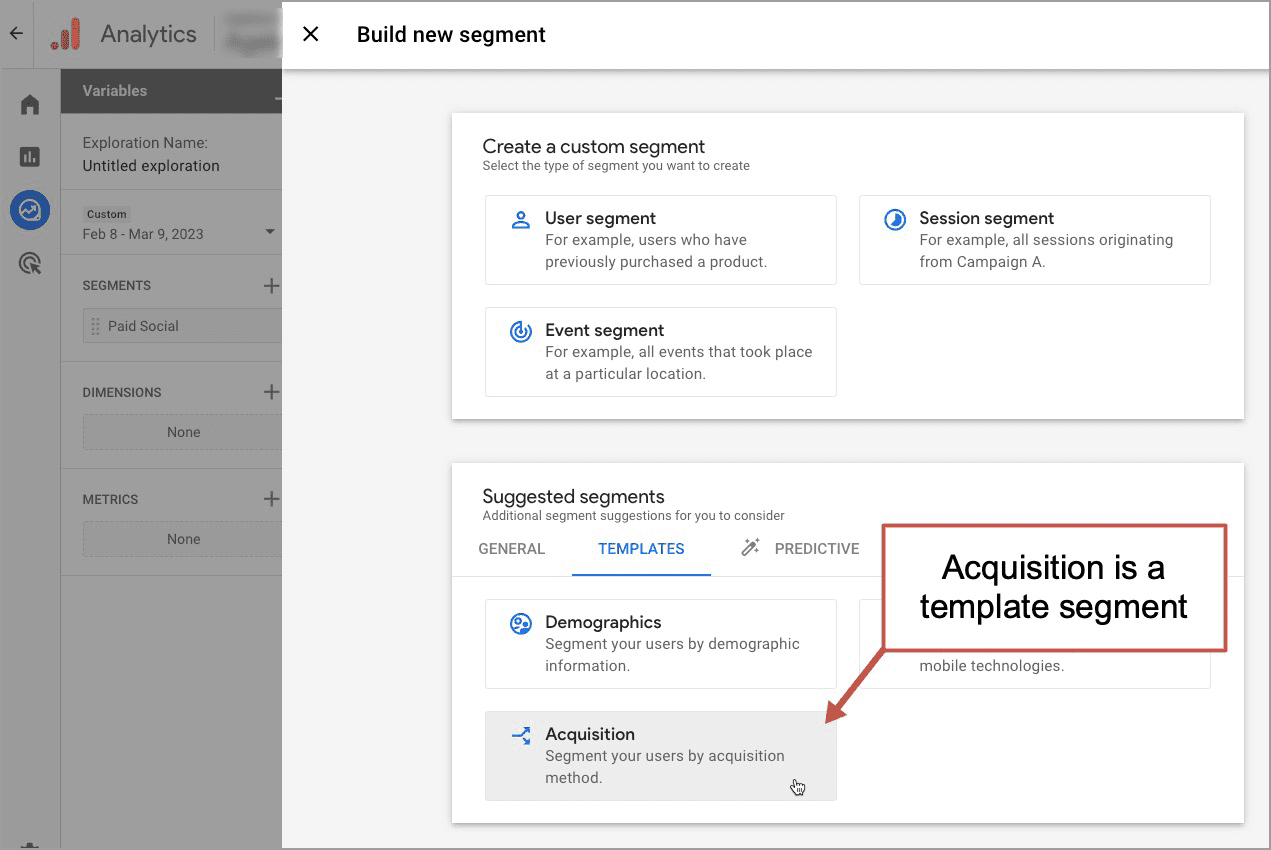
- In the Explorations, start with a Blank exploration
- Click the plus next to segments to create a new segment. In the Suggested segments box, there is a tab for templates where you’ll find Acquisition segments
- Name your segment and select the traffic source. Here we’ll use “First user default channel group” when it contains “Paid social.” It will show us the default channel group for the first time that user came to the website. This is first-click attribution.
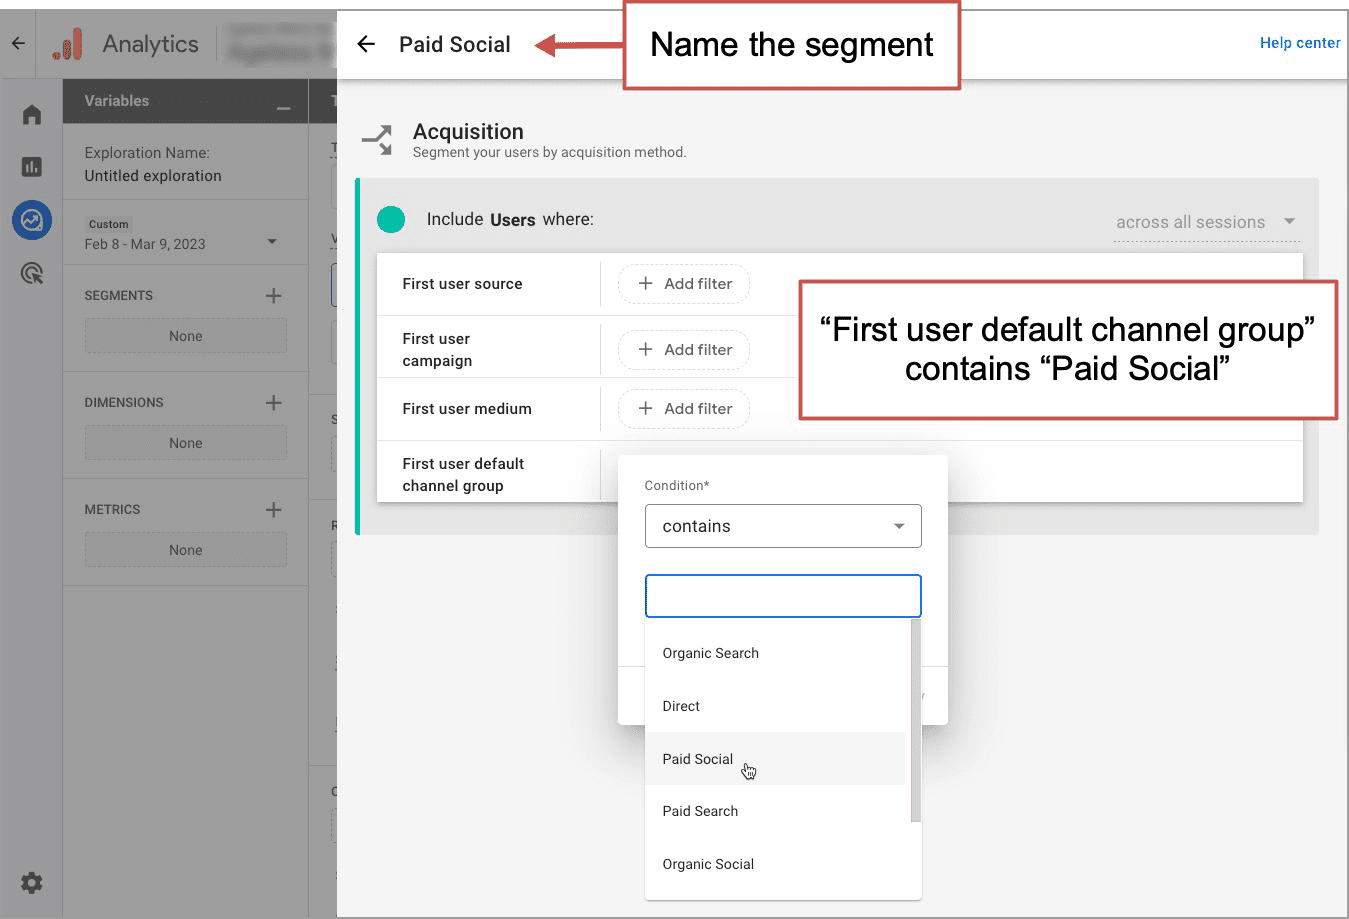
- Next, we’ll create a second segment for “Organic social”
- Click the plus sign next to DIMENSIONS and add “City”
- Click the plus sign next to METRICS and add “Sessions” and “Session conversion rate”
- Put the dimension into the ROWS box and the metrics into the VALUES boxes.
Here is the exploration. I’ve changed the cell type to “Heat map” to add a little color.
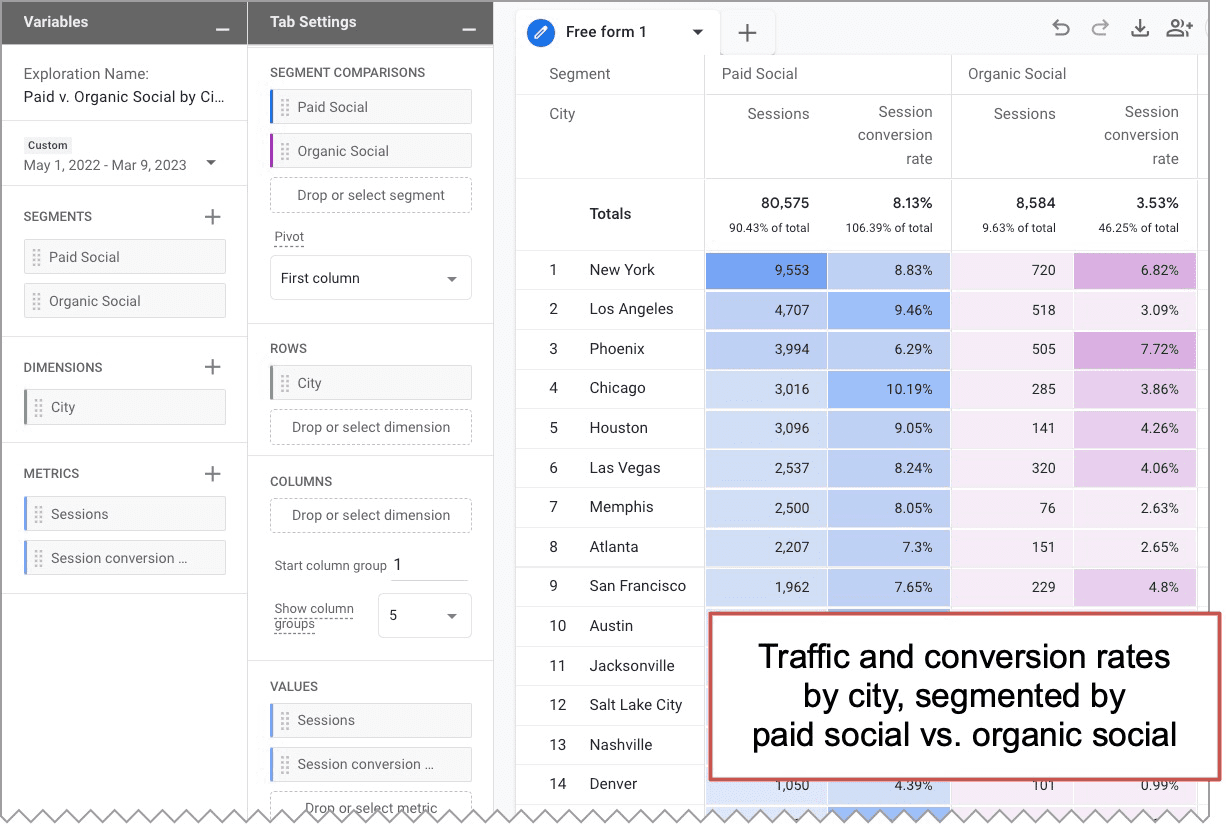
Now you can see the performance of paid and organic social media across cities. Notice how conversion rates from social ads are much better in some cities. Visitors in Chicago are 60% more likely to convert than visitors from Phoenix. That’s a big difference.
In this case, you could have used columns instead of segments and gotten the same report. GA4 segments are probably most useful for ecommerce websites with a lot of traffic, where you might combine several attributes such as purchasers who came from social traffic sources.
Don’t be surprised if…
- Your co-workers are amazed by the insights you bring to your next marketing meeting.
The best social media marketers know analytics
Social media marketing is challenging.
It takes strategic focus. It takes consistency. It takes empathy and hard work. Ask any social media manager. So we need to measure the impact of those efforts. And make sure to go beyond the basic social media metrics.
Measuring social media marketing is also challenging.
It takes a bit of skill to get to the insights in Google Analytics. And today that means quickly getting up to speed with GA4. Even then, when everything is tracking properly, your data won’t be 100% accurate.
The goal is to get good enough data to make good marketing decisions. That is definitely possible, even when tracking a tricky, diverse source of traffic like social media in a new tool like GA4.
And remember, there’s more to social media than dumping links into social streams. Social is a channel for networking, listening, building real relationships and making friends.
The best social media outcomes aren’t in your Analytics.
Let’s close with a few thoughts from Brooke Sellas, a social media customer service pro, who knows that social is more than a content promotion platform.
 |
Brooke Sellas, B Squared Media“Brand conversation is critical for conversions on social media — shoppers on social weight brand conversations are as high or higher than online reviews. And all the social media algorithms weigh conversations heavily, too. Commenting as your brand gives you exposure, shows that you’re listening, builds connections, and has one of the highest ROIs on social media!“ |
BONUS! How to do social media tracking using a URL builder and campaign tracking code
Social media campaigns can and should be tracked with campaign tracking code. Without it, some visitors will be categorized as direct traffic, others will be tracked as referral traffic. It’s a problem.
Campaign tracking code is that bit of info you can add to the end of any link to your website. When the visitor clicks that link and lands on your page, this code is in the address bar. Google Analytics sees it there and attributes that visitor to that campaign.
This code is very easy to add. It takes less than a minute. It can be added using any of the free “URL builders” on the web. There are many, but we’ve built our own:
Click here to see Orbit’s own URL builder for GA4
Ours is a little easier than most because it forces lowercase.
Here’s how to use a URL builder to add campaign tracking code to track your social media performance for any social media campaign.
Step 1. Enter the link to your website in the first box
For example, if I want to track traffic to this little article about content promotion, I’d add this link into the first form field: https://www.orbitmedia.com/blog/content-promotion-strategy/
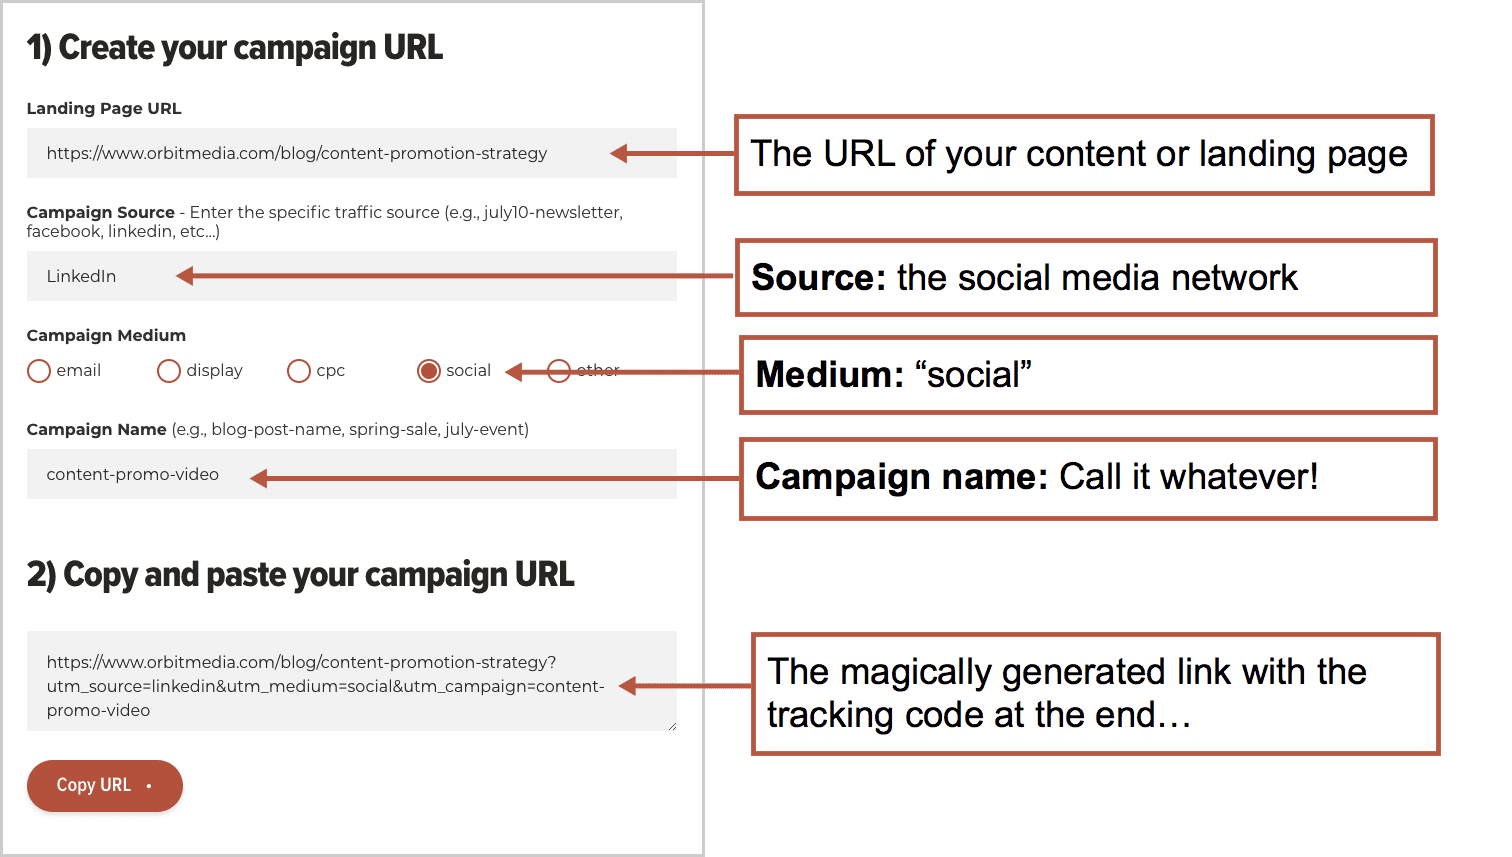
Step 2. Set the campaign’s source, medium and name
These are the three tracking “parameters.”
- Campaign source: “Source” is the specific origin of traffic. In this case, it’s the name of the social media network, such as “linkedin.”
- Campaign medium: “Medium” is the broadest origin of traffic. Select “social.”
- Campaign name: This can be anything you’d like. Give it a name that will be meaningful to anyone scanning through the campaign report, such as “content-promo-video”
As you entered these three bits of info, a new URL with the tracking code appended to it appears below. In this example, it looks like this: https://www.orbitmedia.com/blog/content-promotion-strategy/?utm_source=linkedin&utm_medium=social&utm_campaign=content-promo-video
Step 3. Click “Copy URL” Here’s what it looks like in the URL builder:
Step 4: Use that (instead of the untagged link) in your social media campaign
Now when that link gets clicked, Analytics will know that they came from this campaign and will report on that visit in the Traffic acquisition report when you select “Campaign source” as the dimension.
Easy peasy lemon squeezy!