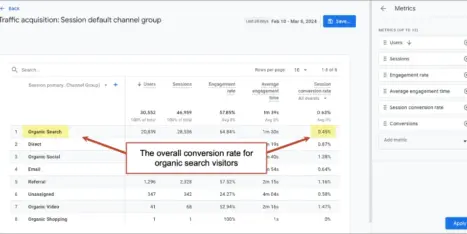
We all know that Google Analytics (GA) is a very powerful tool, but it’s also easy to get lost in there when you don’t know what you are looking for. Knowing what to look for requires asking yourself the right questions, but then comes the task of knowing where to look for the answer.
In the world of content, too many marketers burden themselves with the “more is better” mentality. Create as much content as possible and that’s how the world (and Google) will find you.
On the other hand, what if you could create better content, more often?
In order to help guide you, here are 8 different ways to use Google Analytics to help you not only ask the right questions, but also navigate through the various reports to find the answers. For the most part, these are in order of easiest to hardest as far as GA-savviness.
Note: if you haven’t setup your Analytics you’ll need to do that first. Here’s a guide on how to set up Google Analytics for reference.
Let’s start with a few guidelines and lessons prior to jumping in:
- If you are comparing multiple pieces of content, make sure that you are utilizing comparable time frames for each piece in order to extract meaningful information. For example, if you launch a content piece on June 1st and a second one on July 1st, don’t look at June and July as a whole to see which piece performed better – instead utilize equal timeframes for both.
- Great content can get shared and re-shared at various stages over time. Based on the questions you are asking, it’s best to use a longer date range to get a more complete picture.
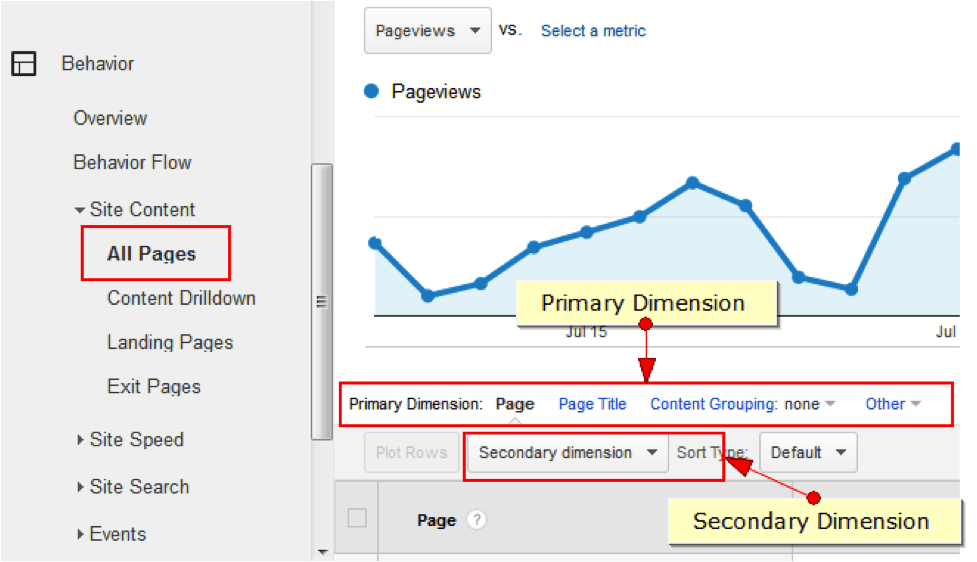
- Unless otherwise noted, most of these reports are found by utilizing the All Pages report, which is housed under Behavior and Site Content, and then adjusted by changing the primary and secondary dimensions accordingly. Bonus points for setting up advanced segments or analytics profiles that only contain the traffic to the content pieces you are researching.
1. Page Views
Obviously this is the easiest, but the list would be incomplete without it! You can answer questions about the general popularity of individual pieces, or which pieces are better as landing pages or supplemental pages on your website.
Rather than strictly looking at pageviews though, perhaps apply some content groupings based on subject matter, or even author. Read up on how content groupings work and how these could apply to your organization.
2. Page Views by Source
Want to figure out which marketing medium is best at attracting visits to your content pieces? Which ones are doing well in social vs. organic? Better yet, what can be improved on existing pieces to garner more traffic with some small changes?
See, now we’re asking better questions!
Simply drill down to the tabular data that you want to see (step 1 below) so that you aren’t mixing in your homepage and other landing pages with your content pieces, and select Medium as the secondary dimension (step 2).
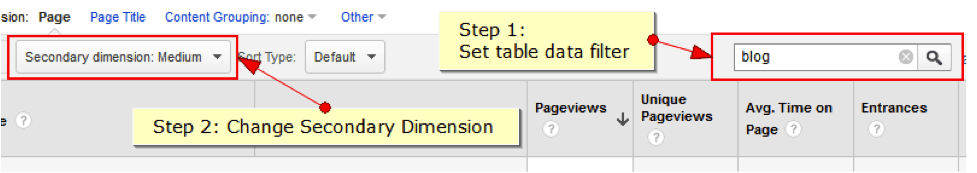
Depending on your website architecture, you may need to get a little more detailed on your table filter by utilizing the advanced options. The output using the above steps will be a list of your URLs in the first column, with the medium in the second column. You can look at these in aggregate, or drill down into individual content pieces to see how performance changes from piece to piece or type to type.
Next up, sort by unique pageviews, bounce rate, average time on page, page value, etc. to get an idea of which pieces are doing well and which ones should be improved.
3. Page Views by Title
Which titles are getting the most clicks? Do list-based posts like this one perform well for you? Do you get more traffic to content pieces with Buzzstreamy titles? Do you get more value (aka assisted revenue or conversions) from titles that aren’t just clickbait?
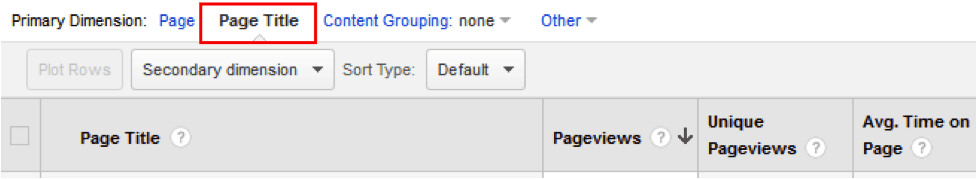
Select Page TItle as the primary dimension and then begin slicing and dicing the data.
4. Referral Visits
It’s one thing to attract traffic utilizing your own marketing channels, but how many visits are you receiving from other websites? This can be a great way to help measure the content pieces that best resonated with others since they were willing to link to it. You can also use this report to learn which types of content pieces were attracting links so as to create similar styles of content in the future to help increase inbound links for SEO purposes.
This one can get a little tricky to navigate properly, but the easiest way to view this information is to go to the Acquisition > All Referrals report and then set the primary dimension to Landing Page.
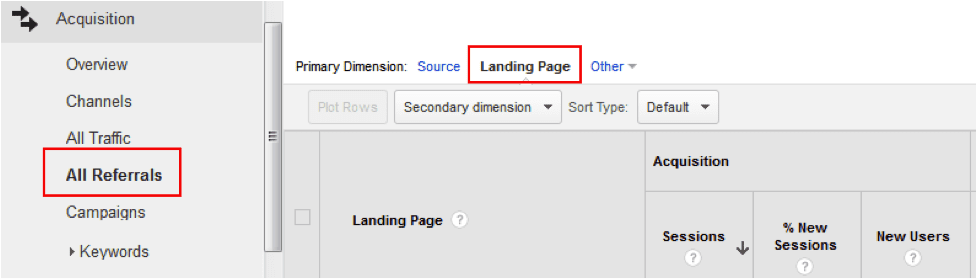
At that point you can take it a step further and use the table filter above the tabular data to exclude the homepage and other non-content pieces.
5. Social Referrals
Much like the referral visits, it’s great to know what types of content get shared across different channels. Facebook and LinkedIn are two very different audiences, for example, so knowing what is working well in the various networks will help you target and segment content even further.
Utilize the Acquisition > Social reports, specifically the Network Referrals and Landing Pages reports. Drilling down into each row of data will provide further insight. You can apply primary and secondary dimensions as outlined in the above tip to segment further.
Bonus tip for social referrals – you can add a secondary dimension for day of the week to see which days perform the best for your social channels.
6. Weighted Sort
While not a report, weighted sort is pretty close to being your analytics best friend. It takes statistically irrelevant data and karate chops it into useful and actionable information.
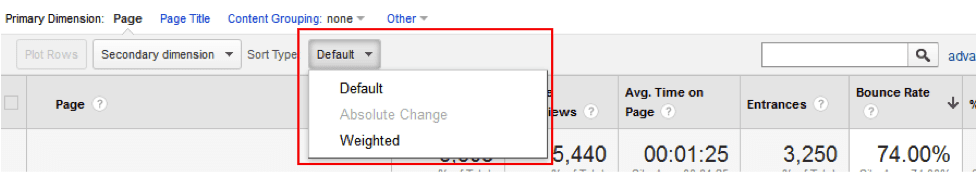
I’m never a fan of bounce rate as a KPI, but in this case, it can be a learning tool. Utilize an advanced segment or a content grouping to get all of your content pieces into the table data. Sort by bounce rate and then use the handy dandy weighted sort option.
View by highest bounce rate to figure out how to improve those pieces to keep people moving on to another page and conversely, see which pieces are pushing people to a second page and beyond. There are several data points that you can use the weighted sort for, but not every piece of data in GA can be sorted with such awesomeness. Hey, don’t shoot the messenger!
Additional reading: Is bounce rate important? What’s a good bounce rate?
Note: Not every content piece or traffic medium is going to perform exactly the same way. Always keep in mind the marketing medium and the intention of the content piece when trying to create your next steps.
7. Demographic Reports
Let’s say that your question is; How do I find similar people to market this great content to? If you were going to set up a Facebook sponsored post, wouldn’t it be great if you already knew who was reacting positively to the content via other marketing channels?
There are a lot of great ways to do remarketing and retargeting. By using the Audience > Demographics and Interests reports you can fine-tune your other marketing efforts.
8. Page Value
Also not technically a report, this is a data point that is, unfortunately, not widely utilized. Page Value can be found most times as the right-most column in the tabular data on the Site Content reports. You need to have goals (and/or e-commerce tracking) set up prior to utilizing this information, including a goal value. Unfortunately, this is one of the “wow this could be really helpful” aforementioned data points that won’t work with the weighted sort type.
Haven’t set goal values up yet? Learn how to create goal values in Google Analytics. Keep in mind that these numbers don’t even need to be entirely accurate as goal values, it’s simply to help give the data some relative information to work with.
Go ahead, go do that now, I promise this post will still be here when you come back.
The only question you have to ask yourself here, do you want to create content that helps you generate more revenue? Focus on creating more content similar to the ones that have higher page values.
Conclusion
As you can see, there are many different ways to evaluate the performance of your content marketing, and simply stopping at pageviews is short-sighted towards the business goals that most companies have in place. By learning what questions to ask, you can now start to properly evaluate your efforts in order to constantly improve your future content marketing efforts.
How do you use Google Analytics to improve your content marketing? We’d love to hear how you do it in the comments below.